Milton Markets
Markets
Trading
Company
Partners
Sign InOpen Account
  1. Home/
  2. Market Analysis/
  3. USDJPY Drops Below 150 JPY Amid Rising Expectations for BOJ Rate Hike【December 2, 2024】
Koki Ando•Dec 2, 2024

USDJPY Drops Below 150 JPY Amid Rising Expectations for BOJ Rate Hike【December 2, 2024】

Koki Ando headshot

Daily Market Analysis

Koki AndoChief Market Analyst

Expert analysis of today's market movements and trading opportunities

Koki Ando headshot

Daily Market Analysis

Koki AndoChief Market Analyst

Expert analysis of today's market movements and trading opportunities

Fundamental Analysis

  • BOJ Governor Suggests Rate Hike Timing Is Near
  • The BOJ governor commented that further JPY depreciation poses significant risks and requires action.
  • With the December meeting approaching, expectations for a rate hike have grown, pushing USDJPY below 150 JPY.

USDJPY Technical Analysis

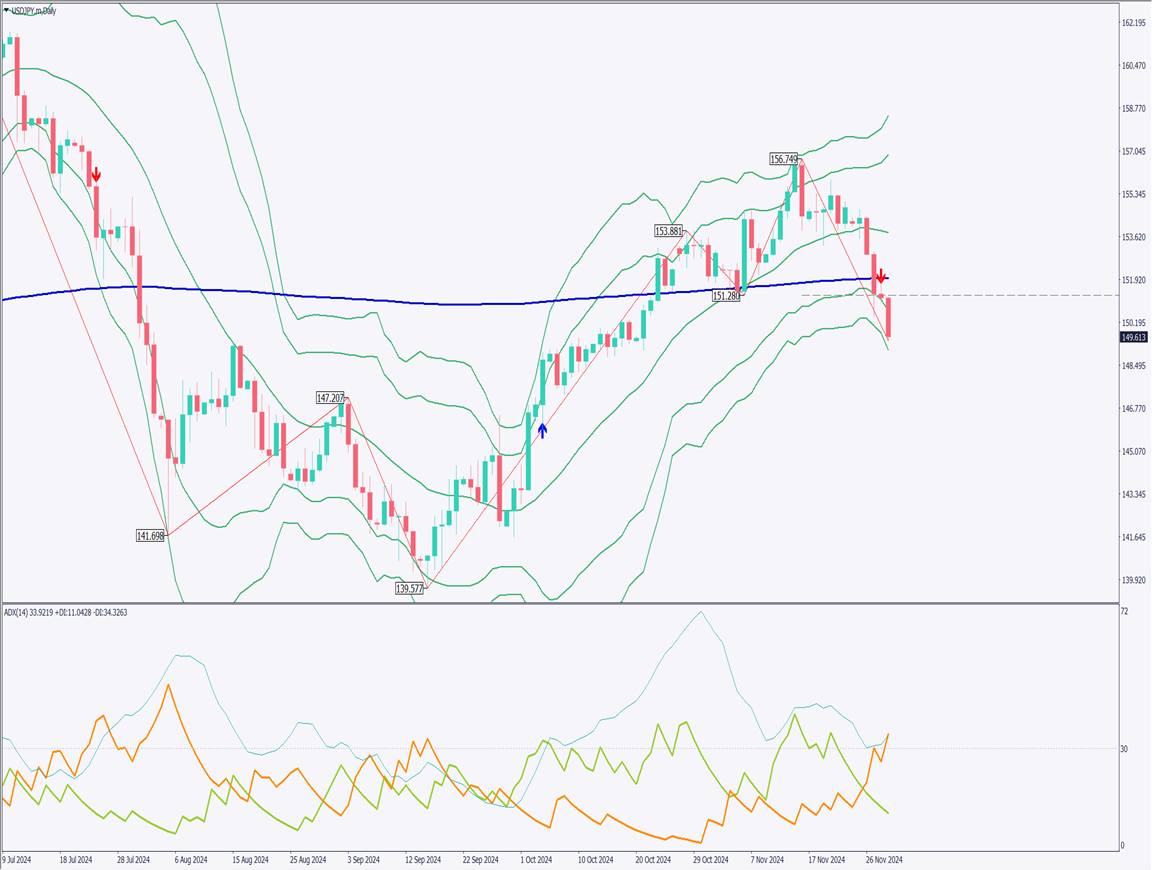
Analyzing the USDJPY daily chart: USDJPY closed at 149.60 JPY, falling below the 240-day moving average. The Bollinger Bands indicate that USDJPY has breached the -2σ line and is approaching the -3σ line.

This decline reflects the BOJ governor’s statements about the proximity of a rate hike and concerns about excessive JPY depreciation. The BOJ policy meeting scheduled for December 18–19 raises expectations for a rate hike, driving JPY buying. Additionally, the FOMC on December 17–18 adds to the importance of the third week of December.

If USDJPY falls below 149 JPY, it may rapidly decline to the 147 JPY range. Historical trends suggest there is no strong support line around the 148 JPY level, warranting caution against JPY appreciation risks.

The ADX stands at 33, with the -DI at 34, signaling a continued downtrend.

[USDJPY / D1]

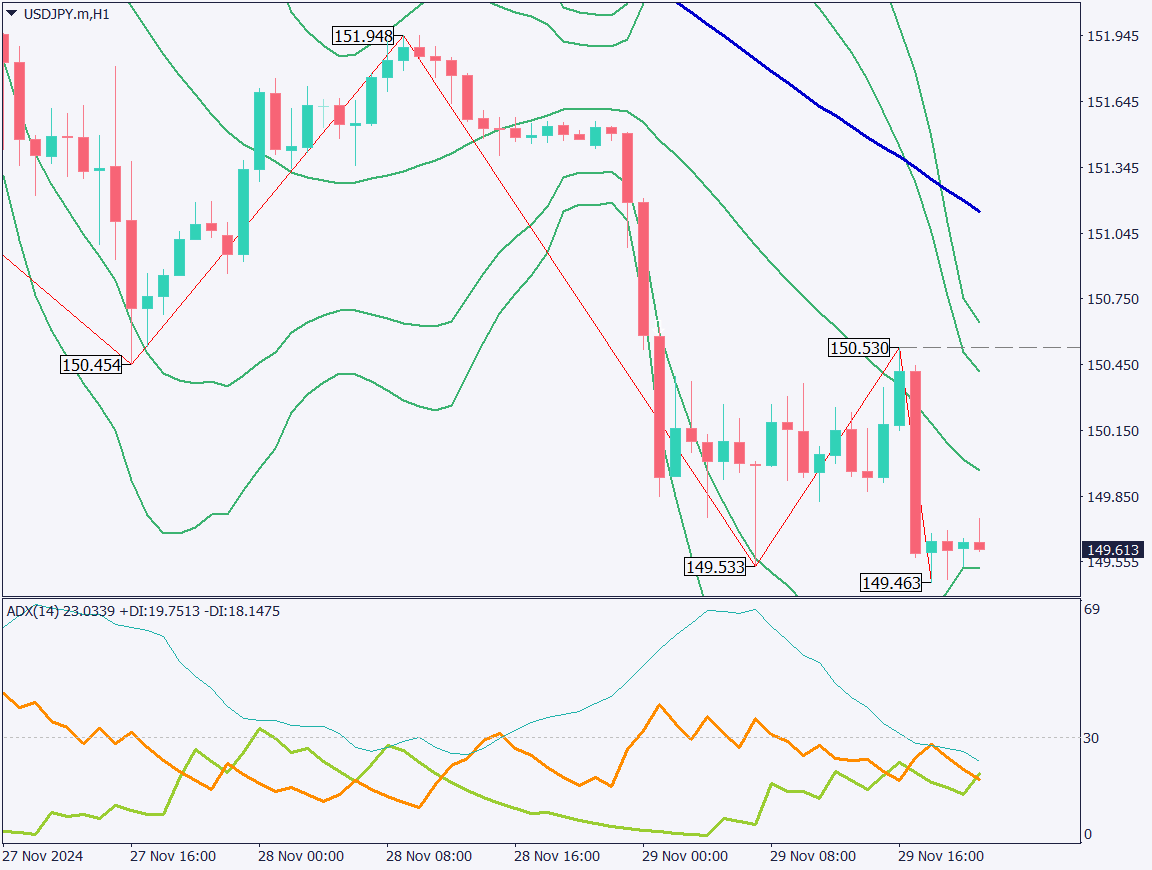
Day trading strategy (1 hour)

Analyzing the USDJPY 1-hour chart: USDJPY appears to have support at 149.50 JPY. The downtrend is becoming more evident, with USDJPY and other cross-yen pairs being sold.
If BOJ rate hike expectations for mid-December rise further and dovish expectations for the FOMC increase, the narrative of USD selling/JPY buying will solidify.

Key level to watch: a break below 149 JPY. If this level is breached, USDJPY may drop sharply to the 147 JPY range. Until the BOJ meeting, it is advisable to trade with JPY appreciation in mind.

Day Trade Strategy

  • Sell on rebounds: Place a sell limit order around 150.05 JPY.
  • Target profit: Early 149 JPY range.
  • Stop-loss: Above 150.25 JPY.

Support/Resistance lines

Key support and resistance lines to consider:

  • 147.20 JPY: Historical significant level
[USDJPY / H1]

Market Sentiment

USDJPY: Sell: 41% / Buy: 59%

Today’s important economic indicators

Economic Indicators and EventsJapan Time
Australian Retail Sales10:30
EU Unemployment Rate19:00
US Manufacturing PMI23:45
US ISM Manufacturing PMIMidnight

*Trading advice in this article is not provided by Milton Markets, but by Shu Fujiyasu Jr., a certified technical analyst.

Ready to trade?

Open live account

Related Analysis

No Currency Intervention Conducted; Reports of Additional Tariffs on South Korea

No Currency Intervention Conducted; Reports of Additional Tariffs on South Korea

20 days agoRead more →
Can Gold Renew Its Record High?

Can Gold Renew Its Record High?

10 days agoRead more →
USD/JPY: Selling Pressure Dominates on Rallies

USD/JPY: Selling Pressure Dominates on Rallies

6 days agoRead more →

This material is for informational purposes only and does not constitute investment advice. Trading leveraged products involves significant risk of loss. Past performance is not indicative of future results.

Share

X

Start trading today

  • Fast execution
  • Competitive spreads
  • 24/7 support
Open live accountView account types
Milton Markets
Twitter/XYouTube

Markets

FOREX
CRYPTO
COMMODITIES
INDICES
STOCKS

Trading

  • Flex Account
  • Smart Account
  • Elite Account
  • MetaTrader 5 (MT5)
  • MetaTrader 4 (MT4)
  • Launch WebTrader
  • Learn Hub
  • Economic Calendar
  • Promotions

Company

  • About Us
  • NDD Technology
  • Customer Protection
  • Execution Conditions
  • Company News
  • Blog
  • Market Analysis

Partners

  • IB Program
  • PAMM Program
  • White Label
  • Investor Login
  • Manager Login

Support

  • Terms of Service
  • Privacy Policy
  • Risk Disclosure
  • Contact Us
  • Help Center
  • My Page Login
Milton Markets is a trading name of Milton Markets Ltd. Milton Markets Ltd. is part of Milton Global and is registered in Saint Lucia (Registration Number: 2023-00166). As part of Milton Global, we adhere to the same high regulatory standards as Milton Global Ltd, which is regulated by the Seychelles Financial Services Authority (FSA) under license SD040.
Risk Warning: CFD trading carries high risk and may not suit all investors. You may lose more than your initial investment. Ensure you understand the risks before trading.
Restrictions: Milton Markets does not provide services to the following countries (not limited to these): United States, Canada, European Union countries, Iran, North Korea, Saint Vincent and the Grenadines, Afghanistan, American Samoa, Belarus, Russia, Burundi, Central African Republic, Congo (Brazzaville), Cuba, Iraq, Lebanon, Liberia, Libya, Myanmar, Puerto Rico, Rwanda, Somalia, Sudan, Syria, US Virgin Islands, Venezuela, Yemen, Zimbabwe, Côte d'Ivoire, Mali, Guinea, Eritrea.
You must be 18 years old or the legal age in your country of residence.
By opening an account, you are considered to have registered of your own volition without solicitation from Milton Markets.
Disclaimer: This website does not constitute investment advice. Content should not be construed as personal advice. Seek independent financial advice.
© 2026 Milton Markets. All rights reserved.
TermsPrivacyCookiesRisk