Milton Markets
Markets
Trading
Company
Partners
Sign InOpen Account
  1. Home/
  2. Market Analysis/
  3. Gold Continues to Hit Record Highs, Risk Aversion Intensifies【February 5, 2025】
Koki Ando•Feb 5, 2025

Gold Continues to Hit Record Highs, Risk Aversion Intensifies【February 5, 2025】

Koki Ando headshot

Daily Market Analysis

Koki AndoChief Market Analyst

Expert analysis of today's market movements and trading opportunities

Koki Ando headshot

Daily Market Analysis

Koki AndoChief Market Analyst

Expert analysis of today's market movements and trading opportunities

Fundamental Analysis

  • Gold Continues to Set Record Highs, Rising to Around 2,840 USD
  • Despite absorbing tariff policy changes, market uncertainty remains high.
  • USDJPY Drops to 154 JPY as Expectations for BOJ Rate Hike Grow

XAUUSD Technical Analysis

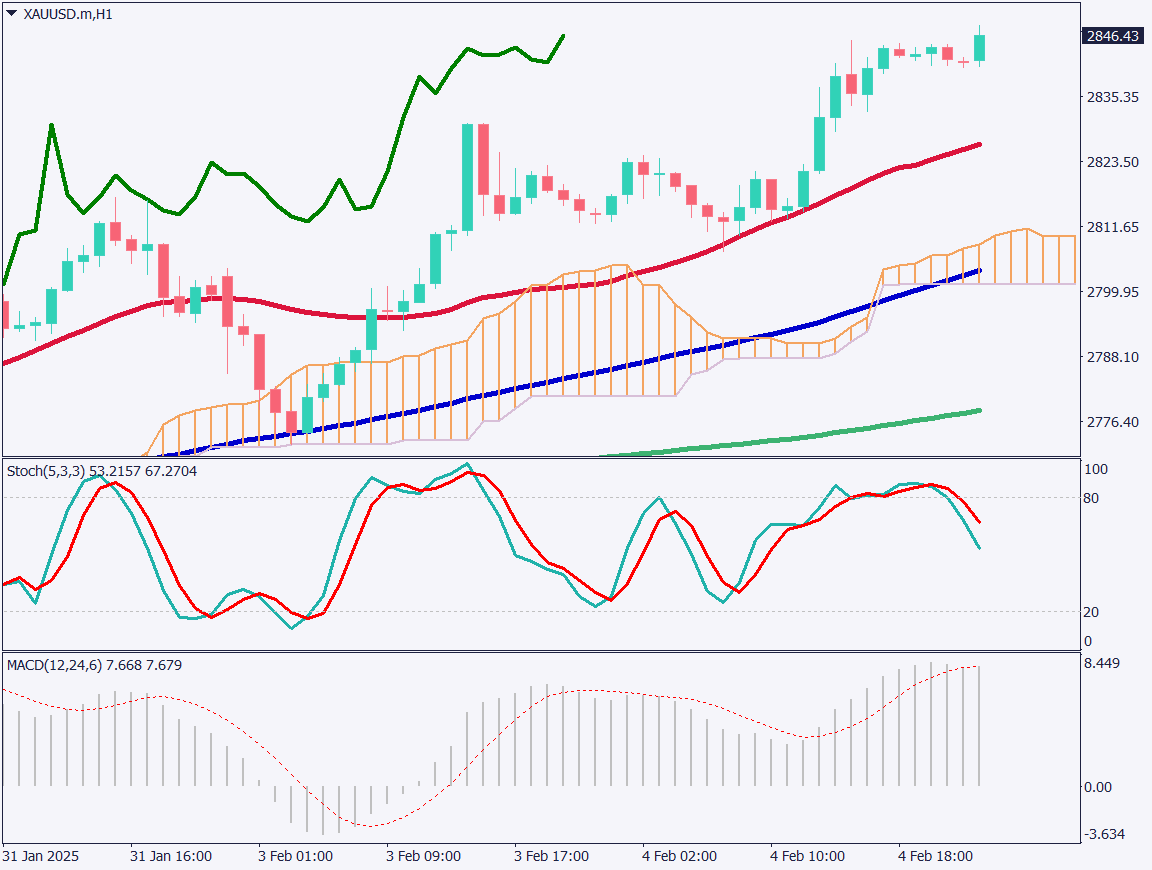
Analyzing the daily chart of gold, we see that it continues to hit record highs. After breaking above 2,800 USD, gold surged to 2,848 USD. Factors such as uncertainty over tariff policies and a rebound in Canada have influenced this movement. Although the stock market is digesting these developments, risk aversion continues to strengthen.

From a technical perspective, the 28-day moving average has crossed above the 90-day moving average, forming a golden cross. According to Granville’s Rule, when a short-term moving average that once dipped below a long-term moving average crosses back above it, it indicates a strong bullish trend.

However, the Stochastic Oscillator is in the overbought zone, suggesting a possible overvaluation. Meanwhile, MACD continues to form a significant peak, confirming the strong upward momentum.

[XAUUSD / D1]

Day trading strategy (1 hour)

Analyzing the 1-hour chart of gold, the 28-period moving average is acting as a support line, with the price rebounding from the short-term moving average, indicating strong bullish momentum. The Stochastic Oscillator is pointing downward, and the MACD histogram shows a weakening upward momentum.

From a fundamental perspective, a buy-on-dip strategy remains favorable.

Day Trading Plan:

  • Entry: Place a limit buy order around 2,830 USD, expecting a rebound.
  • Stop Loss: If the price falls below 2,825 USD, exit the trade.
  • Take Profit: If the price rises to 2,872 USD, close the position.

Support/Resistance lines

Key support and resistance lines to consider:

  • 2,855 USD – Pivot R1
  • 2,833 USD – Monthly Support Line
[XAUUSD / H1]

Market Sentiment

XAUUSD: Sell: 65% / Buy: 35%

Today’s important economic indicators

Economic Indicators and EventsJapan Time
Japan Nikkei Services PMI9:30
US ADP Non-Farm Employment Change22:15
US Services PMI23:45
US ISM Non-Manufacturing Index00:00 (Midnight)

*Trading advice in this article is not provided by Milton Markets, but by Shu Fujiyasu Jr., a certified technical analyst.

Ready to trade?

Open live account

Related Analysis

USD/JPY Forms a Range — What’s Next?

USD/JPY Forms a Range — What’s Next?

TodayRead more →
USD/JPY dips slightly on LDP landslide victory

USD/JPY dips slightly on LDP landslide victory

7 days agoRead more →
No Currency Intervention Conducted; Reports of Additional Tariffs on South Korea

No Currency Intervention Conducted; Reports of Additional Tariffs on South Korea

20 days agoRead more →

This material is for informational purposes only and does not constitute investment advice. Trading leveraged products involves significant risk of loss. Past performance is not indicative of future results.

Share

X

Start trading today

  • Fast execution
  • Competitive spreads
  • 24/7 support
Open live accountView account types
Milton Markets
Twitter/XYouTube

Markets

FOREX
CRYPTO
COMMODITIES
INDICES
STOCKS

Trading

  • Flex Account
  • Smart Account
  • Elite Account
  • MetaTrader 5 (MT5)
  • MetaTrader 4 (MT4)
  • Launch WebTrader
  • Learn Hub
  • Economic Calendar
  • Promotions

Company

  • About Us
  • NDD Technology
  • Customer Protection
  • Execution Conditions
  • Company News
  • Blog
  • Market Analysis

Partners

  • IB Program
  • PAMM Program
  • White Label
  • Investor Login
  • Manager Login

Support

  • Terms of Service
  • Privacy Policy
  • Risk Disclosure
  • Contact Us
  • Help Center
  • My Page Login
Milton Markets is a trading name of Milton Markets Ltd. Milton Markets Ltd. is part of Milton Global and is registered in Saint Lucia (Registration Number: 2023-00166). As part of Milton Global, we adhere to the same high regulatory standards as Milton Global Ltd, which is regulated by the Seychelles Financial Services Authority (FSA) under license SD040.
Risk Warning: CFD trading carries high risk and may not suit all investors. You may lose more than your initial investment. Ensure you understand the risks before trading.
Restrictions: Milton Markets does not provide services to the following countries (not limited to these): United States, Canada, European Union countries, Iran, North Korea, Saint Vincent and the Grenadines, Afghanistan, American Samoa, Belarus, Russia, Burundi, Central African Republic, Congo (Brazzaville), Cuba, Iraq, Lebanon, Liberia, Libya, Myanmar, Puerto Rico, Rwanda, Somalia, Sudan, Syria, US Virgin Islands, Venezuela, Yemen, Zimbabwe, Côte d'Ivoire, Mali, Guinea, Eritrea.
You must be 18 years old or the legal age in your country of residence.
By opening an account, you are considered to have registered of your own volition without solicitation from Milton Markets.
Disclaimer: This website does not constitute investment advice. Content should not be construed as personal advice. Seek independent financial advice.
© 2026 Milton Markets. All rights reserved.
TermsPrivacyCookiesRisk