Milton Markets
Markets
Trading
Company
Partners
Sign InOpen Account
  1. Home/
  2. Market Analysis/
  3. USDJPY Declines for Four Consecutive Days, Reacting to Hawkish Remarks from BOJ Member【February 7, 2025】
Koki Ando•Feb 7, 2025

USDJPY Declines for Four Consecutive Days, Reacting to Hawkish Remarks from BOJ Member【February 7, 2025】

Koki Ando headshot

Daily Market Analysis

Koki AndoChief Market Analyst

Expert analysis of today's market movements and trading opportunities

Koki Ando headshot

Daily Market Analysis

Koki AndoChief Market Analyst

Expert analysis of today's market movements and trading opportunities

Fundamental Analysis

  • BOJ’s Tamura suggests a 1% rate hike in late 2025
  • Bank of England cuts rates by 0.25%, leading to a downtrend in GBPJPY

USDJPY Technical Analysis

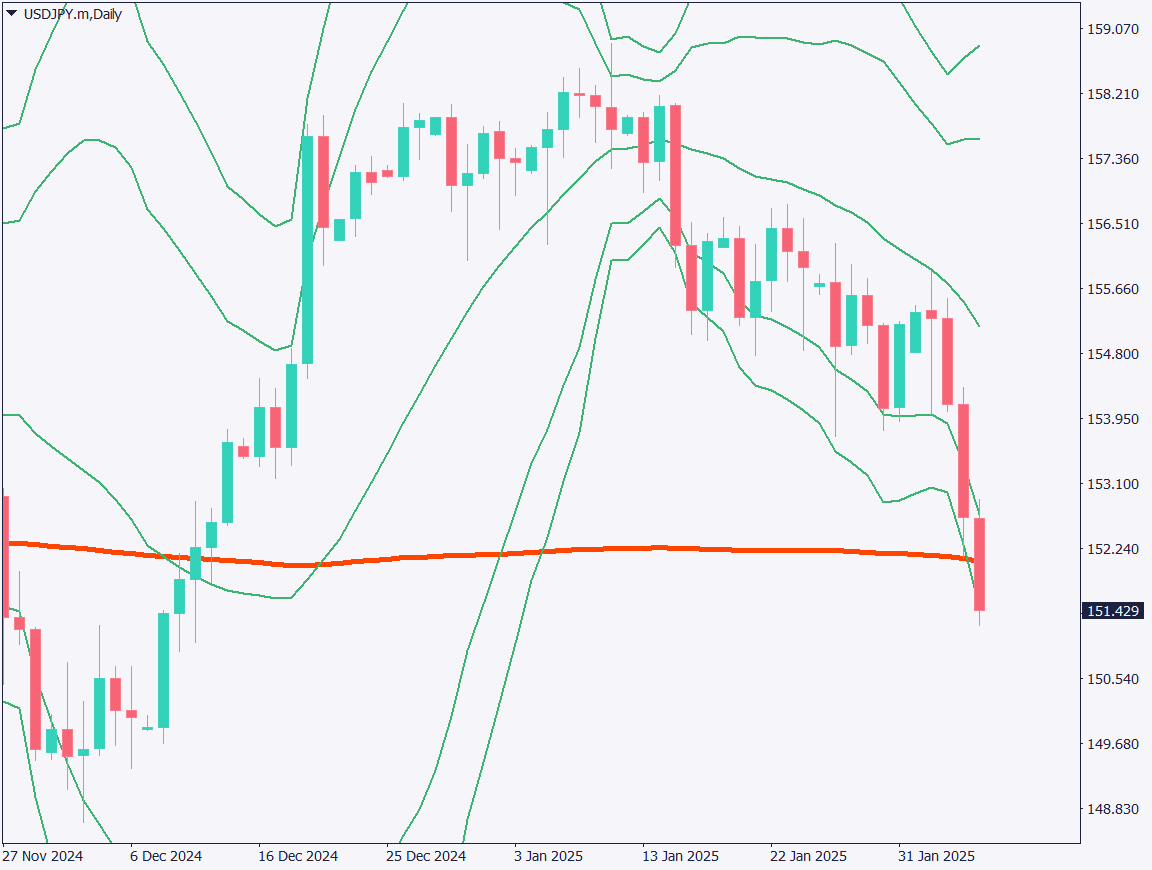
Analyzing the daily chart of USDJPY, the pair has declined for four consecutive days, influenced by hawkish remarks from BOJ’s Tamura, who stated that “interest rates will be at least around 1% in late 2025.” As a result, USDJPY has dropped to just below 150 JPY. Additionally, the pair has broken below the 200-day moving average, suggesting a possibility of further declines below 150 JPY.

However, a Bollinger Bands analysis shows that USDJPY is currently trading below the -3σ line, indicating that a rebound is expected today. Given that candlesticks tend to stay within the 3σ range with a probability of 99.7%, a short-term rebound is likely.

Potential resistance levels for this rebound are:

  • Around 152 JPY, where the 200-day moving average is positioned
  • Around 152.65 JPY, where the -2σ Bollinger Band line is moving
[USDJPY / D1]

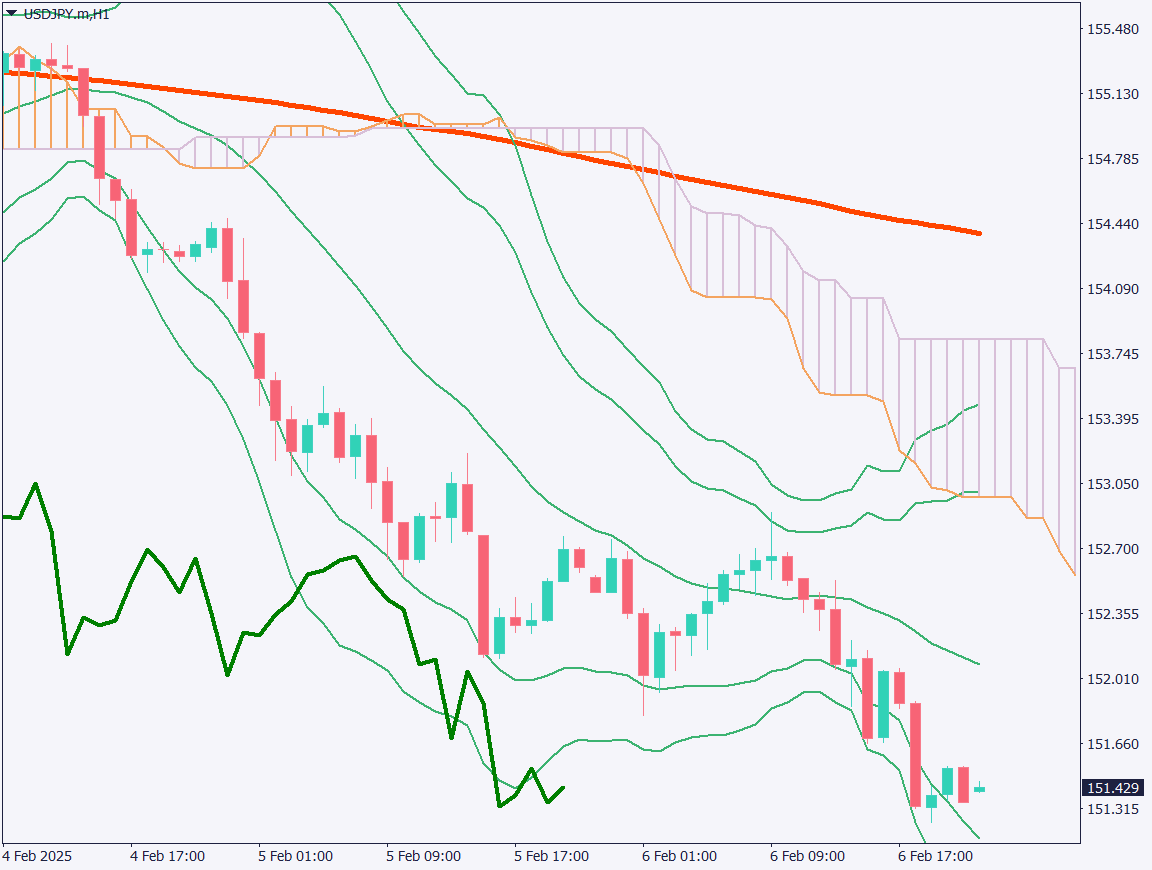
Day trading strategy (1 hour)

Analyzing the 1-hour chart of USDJPY, the downtrend continues but has slowed down. As per the daily analysis, a rebound is expected today. While the long-term trend remains JPY bullish, the strategy for today is to look for selling opportunities on the rebound.

Key resistance levels to watch for selling opportunities:

  • Around 152 JPY, where the Bollinger Bands’ central line is positioned
  • Around 151.80 JPY, where the Ichimoku Cloud’s lower boundary is moving

It is advisable to wait until after the U.S. Non-Farm Payroll (NFP) release to trade in the New York session.

Day Trading Strategy: Sell on Rebounds

  • Sell near 152 JPY
  • Take profit at 151.15 JPY
  • Stop loss at 152.35 JPY

Support/Resistance lines

Key support and resistance lines to consider:

  • 152.65 JPY → Bollinger Bands’ -2σ line
  • 152 JPY → 200-day moving average
  • 151.15 JPY → Major support level
[USDJPY / H1]

Market Sentiment

USDJPY: Sell: 30% / Buy: 70%

Today’s important economic indicators

Economic Indicators and EventsJapan Time
Household Survey & Consumer Spending8:30 AM
U.S. Non-Farm Payrolls (NFP)10:30 PM
Canada Employment Report10:30 PM
University of Michigan Consumer Sentiment IndexMidnight

*Trading advice in this article is not provided by Milton Markets, but by Shu Fujiyasu Jr., a certified technical analyst.

Ready to trade?

Open live account

Related Analysis

No Currency Intervention Conducted; Reports of Additional Tariffs on South Korea

No Currency Intervention Conducted; Reports of Additional Tariffs on South Korea

20 days agoRead more →
USD/JPY dips slightly on LDP landslide victory

USD/JPY dips slightly on LDP landslide victory

7 days agoRead more →
USD/JPY Forms a Range — What’s Next?

USD/JPY Forms a Range — What’s Next?

TodayRead more →

This material is for informational purposes only and does not constitute investment advice. Trading leveraged products involves significant risk of loss. Past performance is not indicative of future results.

Share

X

Start trading today

  • Fast execution
  • Competitive spreads
  • 24/7 support
Open live accountView account types
Milton Markets
Twitter/XYouTube

Markets

FOREX
CRYPTO
COMMODITIES
INDICES
STOCKS

Trading

  • Flex Account
  • Smart Account
  • Elite Account
  • MetaTrader 5 (MT5)
  • MetaTrader 4 (MT4)
  • Launch WebTrader
  • Learn Hub
  • Economic Calendar
  • Promotions

Company

  • About Us
  • NDD Technology
  • Customer Protection
  • Execution Conditions
  • Company News
  • Blog
  • Market Analysis

Partners

  • IB Program
  • PAMM Program
  • White Label
  • Investor Login
  • Manager Login

Support

  • Terms of Service
  • Privacy Policy
  • Risk Disclosure
  • Contact Us
  • Help Center
  • My Page Login
Milton Markets is a trading name of Milton Markets Ltd. Milton Markets Ltd. is part of Milton Global and is registered in Saint Lucia (Registration Number: 2023-00166). As part of Milton Global, we adhere to the same high regulatory standards as Milton Global Ltd, which is regulated by the Seychelles Financial Services Authority (FSA) under license SD040.
Risk Warning: CFD trading carries high risk and may not suit all investors. You may lose more than your initial investment. Ensure you understand the risks before trading.
Restrictions: Milton Markets does not provide services to the following countries (not limited to these): United States, Canada, European Union countries, Iran, North Korea, Saint Vincent and the Grenadines, Afghanistan, American Samoa, Belarus, Russia, Burundi, Central African Republic, Congo (Brazzaville), Cuba, Iraq, Lebanon, Liberia, Libya, Myanmar, Puerto Rico, Rwanda, Somalia, Sudan, Syria, US Virgin Islands, Venezuela, Yemen, Zimbabwe, Côte d'Ivoire, Mali, Guinea, Eritrea.
You must be 18 years old or the legal age in your country of residence.
By opening an account, you are considered to have registered of your own volition without solicitation from Milton Markets.
Disclaimer: This website does not constitute investment advice. Content should not be construed as personal advice. Seek independent financial advice.
© 2026 Milton Markets. All rights reserved.
TermsPrivacyCookiesRisk