Milton Markets
Markets
Trading
Company
Partners
Sign InOpen Account
  1. Home/
  2. Market Analysis/
  3. Gold Eyes USD 3,000 Amid Uncertainty Over Trump’s Tariff Policy【February 19, 2025】
Koki Ando•Feb 19, 2025

Gold Eyes USD 3,000 Amid Uncertainty Over Trump’s Tariff Policy【February 19, 2025】

Koki Ando headshot

Daily Market Analysis

Koki AndoChief Market Analyst

Expert analysis of today's market movements and trading opportunities

Koki Ando headshot

Daily Market Analysis

Koki AndoChief Market Analyst

Expert analysis of today's market movements and trading opportunities

Fundamental Analysis

  • The Trump administration is expected to announce details on tariffs for pharmaceuticals and automobiles around April 2.
  • Gold is approaching its all-time high, with market participants considering the possibility of USD 3,000 becoming a reality.

XAUUSD Technical Analysis

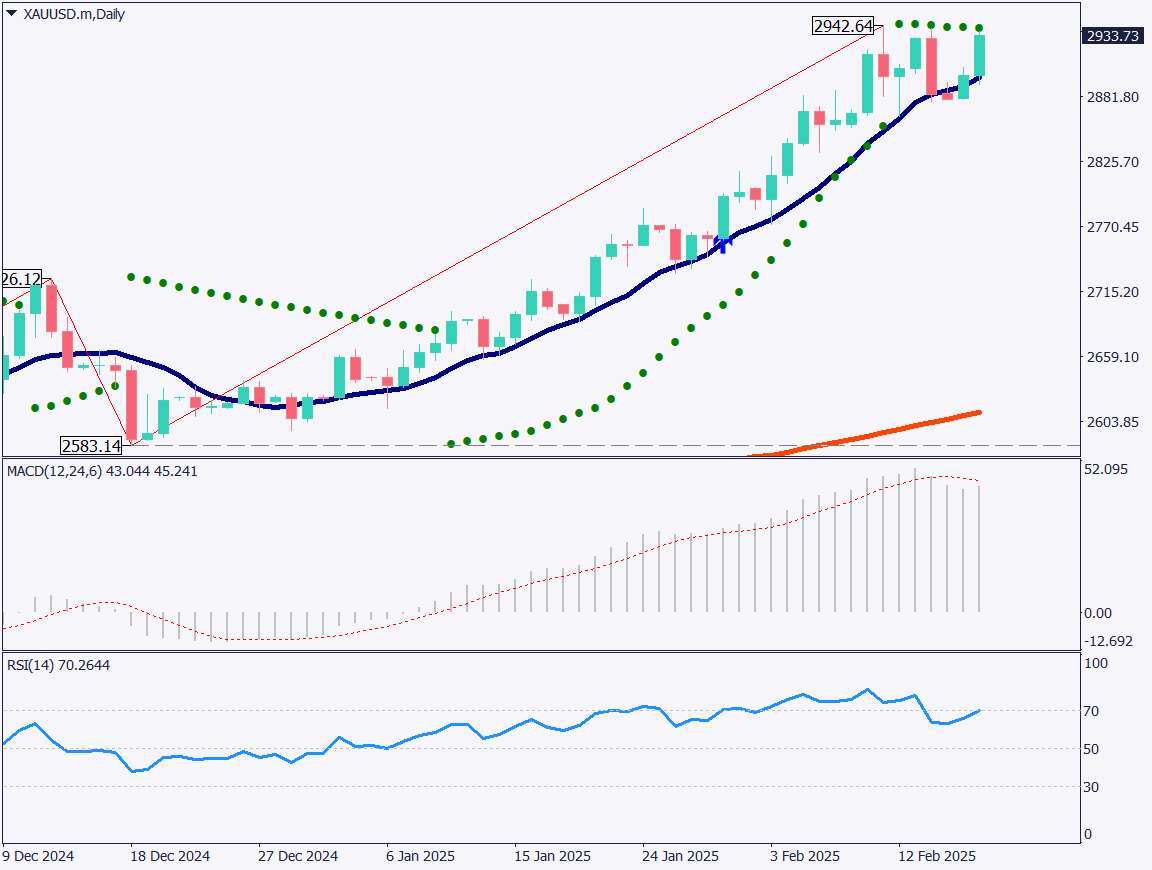
Gold’s daily chart shows that the price is approaching a high of USD 2,934, with a parabolic buy signal expected to be triggered soon. Since January, the price has consistently remained above the 10-day moving average, indicating a strong upward trend. The continuation of this trend above the 10-day moving average suggests that buying pressure is supported not only by technical factors but also by fundamental ones.

The highest price recorded so far is USD 2,942, and attention will be on whether this level can be surpassed within February. The projected high for the month is USD 2,987, making it unlikely for gold to reach USD 3,000 within February. However, March appears to be a more realistic timeframe for achieving that level. The RSI is hovering around 70, staying within the overbought zone, while the MACD histogram is once again showing signs of upward momentum.

[XAUUSD / D1]

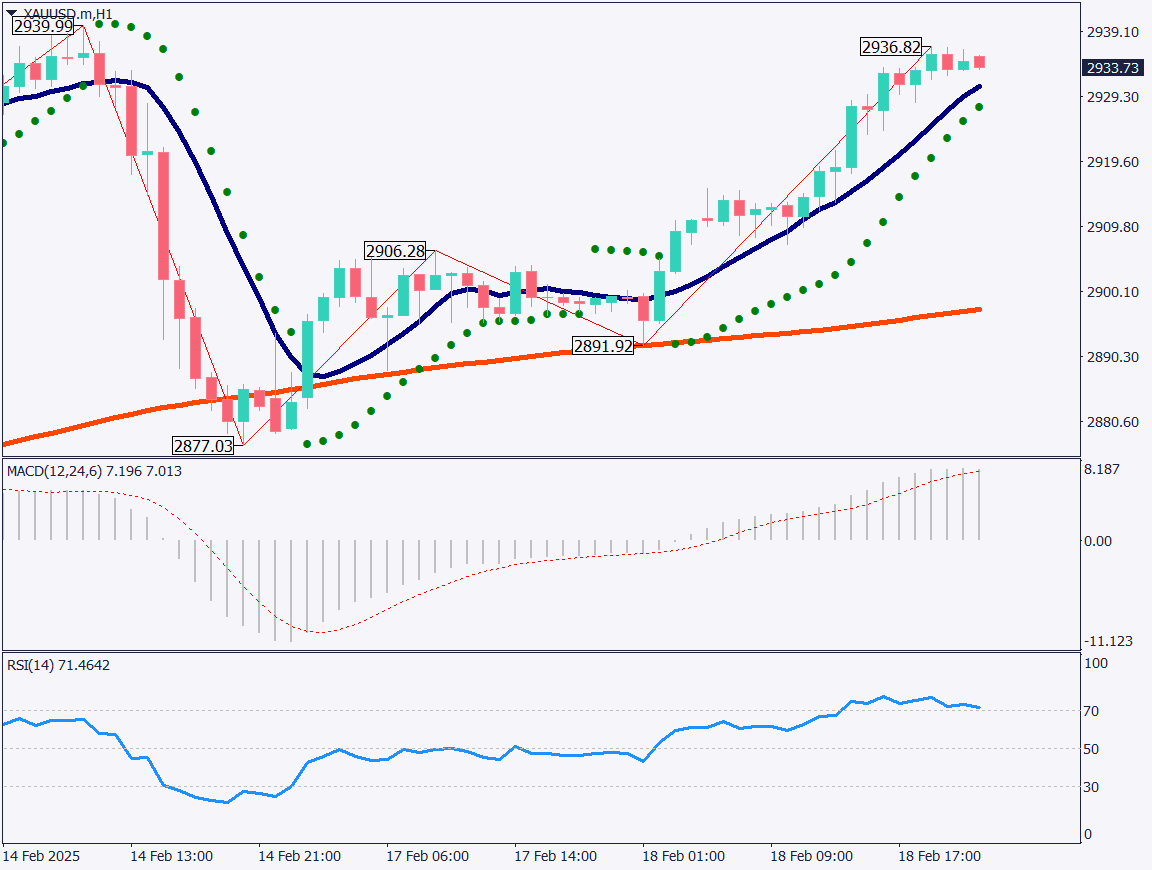
Day trading strategy (1 hour)

Gold’s 1-hour chart indicates that after rebounding off the 200-period moving average, the price reached a high of USD 2,936. The strong upward momentum continues, with the price remaining in the high range and the RSI reaching 71.

Although the bullish trend is intact, the market remains in overbought territory. If the rally stabilizes, a correctional decline may occur. As the price nears USD 3,000, profit-taking and selling pressure could emerge.

For today’s trading plan, a sell limit order at USD 2,960 is recommended, with a take profit at USD 2,935. If the price exceeds USD 2,965, a stop loss should be set while monitoring further market movements.

Support/Resistance lines

Key support and resistance lines to consider:

  • USD 2,972 – Expected resistance
  • USD 2,960 – Expected resistance
[XAUUSD / H1]

Market Sentiment

XAUUSD: Sell: 55% / Buy: 45%

Today’s important economic indicators

Economic Indicators and EventsJapan Time
UK CPI16:00
US Housing Starts22:30

*Trading advice in this article is not provided by Milton Markets, but by Shu Fujiyasu Jr., a certified technical analyst.

Ready to trade?

Open live account

Related Analysis

USD/JPY Forms a Range — What’s Next?

USD/JPY Forms a Range — What’s Next?

TodayRead more →
No Currency Intervention Conducted; Reports of Additional Tariffs on South Korea

No Currency Intervention Conducted; Reports of Additional Tariffs on South Korea

20 days agoRead more →
USD/JPY: Selling Pressure Dominates on Rallies

USD/JPY: Selling Pressure Dominates on Rallies

6 days agoRead more →

This material is for informational purposes only and does not constitute investment advice. Trading leveraged products involves significant risk of loss. Past performance is not indicative of future results.

Share

X

Start trading today

  • Fast execution
  • Competitive spreads
  • 24/7 support
Open live accountView account types
Milton Markets
Twitter/XYouTube

Markets

FOREX
CRYPTO
COMMODITIES
INDICES
STOCKS

Trading

  • Flex Account
  • Smart Account
  • Elite Account
  • MetaTrader 5 (MT5)
  • MetaTrader 4 (MT4)
  • Launch WebTrader
  • Learn Hub
  • Economic Calendar
  • Promotions

Company

  • About Us
  • NDD Technology
  • Customer Protection
  • Execution Conditions
  • Company News
  • Blog
  • Market Analysis

Partners

  • IB Program
  • PAMM Program
  • White Label
  • Investor Login
  • Manager Login

Support

  • Terms of Service
  • Privacy Policy
  • Risk Disclosure
  • Contact Us
  • Help Center
  • My Page Login
Milton Markets is a trading name of Milton Markets Ltd. Milton Markets Ltd. is part of Milton Global and is registered in Saint Lucia (Registration Number: 2023-00166). As part of Milton Global, we adhere to the same high regulatory standards as Milton Global Ltd, which is regulated by the Seychelles Financial Services Authority (FSA) under license SD040.
Risk Warning: CFD trading carries high risk and may not suit all investors. You may lose more than your initial investment. Ensure you understand the risks before trading.
Restrictions: Milton Markets does not provide services to the following countries (not limited to these): United States, Canada, European Union countries, Iran, North Korea, Saint Vincent and the Grenadines, Afghanistan, American Samoa, Belarus, Russia, Burundi, Central African Republic, Congo (Brazzaville), Cuba, Iraq, Lebanon, Liberia, Libya, Myanmar, Puerto Rico, Rwanda, Somalia, Sudan, Syria, US Virgin Islands, Venezuela, Yemen, Zimbabwe, Côte d'Ivoire, Mali, Guinea, Eritrea.
You must be 18 years old or the legal age in your country of residence.
By opening an account, you are considered to have registered of your own volition without solicitation from Milton Markets.
Disclaimer: This website does not constitute investment advice. Content should not be construed as personal advice. Seek independent financial advice.
© 2026 Milton Markets. All rights reserved.
TermsPrivacyCookiesRisk