Milton Markets
Markets
Trading
Company
Partners
Sign InOpen Account
  1. Home/
  2. Market Analysis/
  3. USDJPY Falls to the 148JPY Range for the First Time in Two Months Amid Concerns Over the US Economic Outlook【February 24, 2025】
Koki Ando•Feb 24, 2025

USDJPY Falls to the 148JPY Range for the First Time in Two Months Amid Concerns Over the US Economic Outlook【February 24, 2025】

Koki Ando headshot

Daily Market Analysis

Koki AndoChief Market Analyst

Expert analysis of today's market movements and trading opportunities

Koki Ando headshot

Daily Market Analysis

Koki AndoChief Market Analyst

Expert analysis of today's market movements and trading opportunities

Fundamental Analysis

  • Weak US consumer and housing-related indicators led to a sharp decline in US stock prices.
  • USDJPY rebounded to the low 150JPY range following the BOJ Governor’s comments aimed at curbing rapid interest rate hikes.

USDJPY Technical Analysis

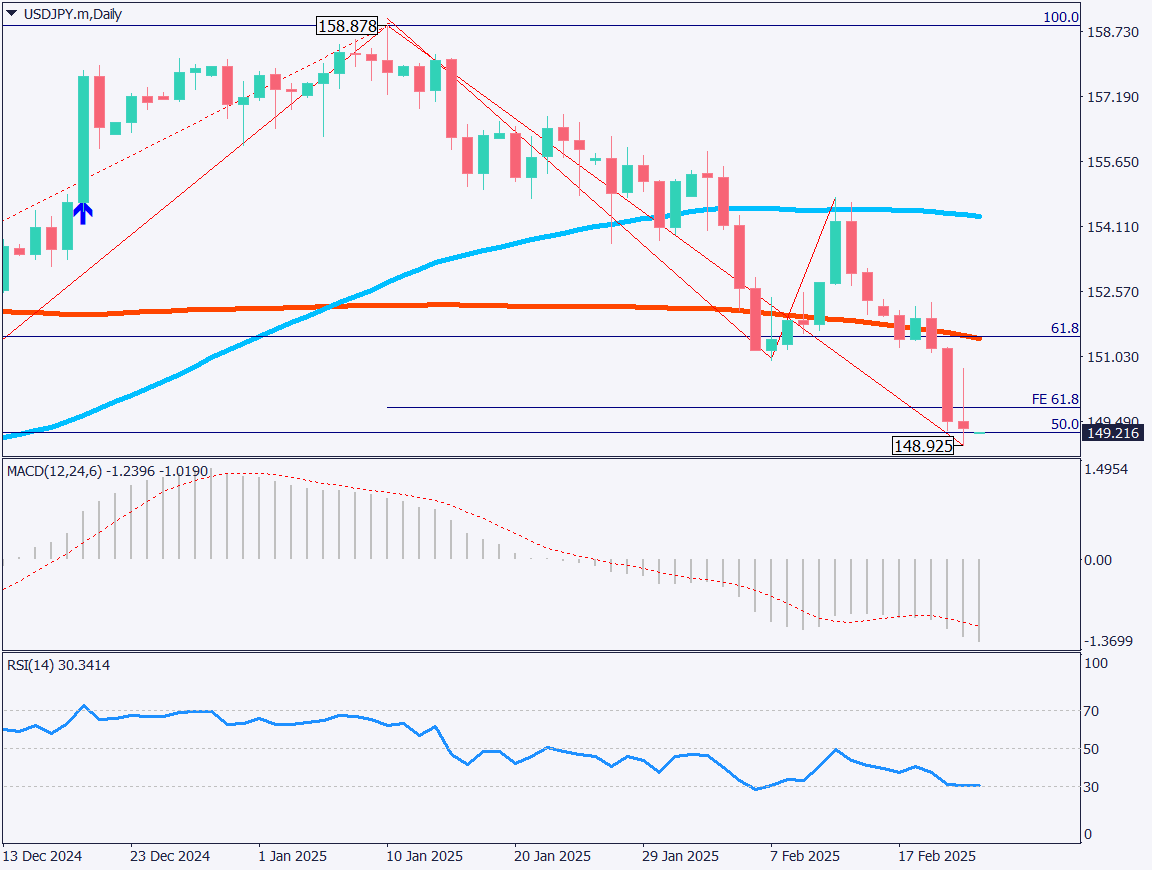
Analyzing the daily chart of USDJPY, the pair has fallen to the 148JPY range for the first time since early December. This drop is attributed to weakening US economic indicators and a sharp decline in US stock indices. Nikkei 225 futures have also plunged.

Previously, strong US economic indicators had stabilized stock prices, but new concerns have emerged. Although inflation expectations remain high, economic uncertainty is weighing on the market.

USDJPY has broken below the 200-day moving average and already updated its recent low. The next key support level is 148.65JPY. The RSI fell from 50 to 30. A broader Fibonacci retracement indicates that the 50% level corresponds to around 149.20JPY.

A key point to watch is whether USDJPY will clearly break below the 149JPY range and update its low to 149.65JPY.

[USDJPY / D1]

Day trading strategy (1 hour)

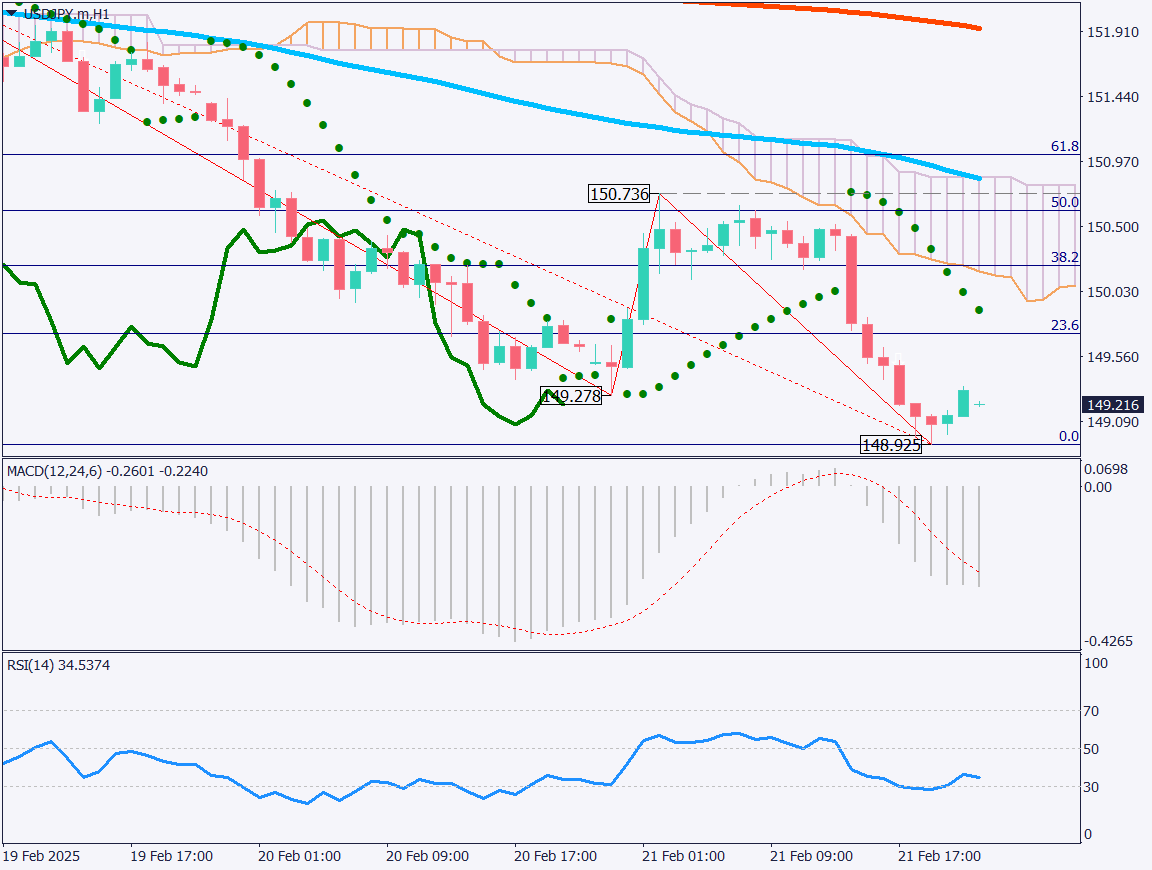
Analyzing the 1-hour chart of USDJPY, the pair rebounded at 148.92JPY and closed in the low 149JPY range. Fibonacci retracement is also in focus on the 1-hour chart, with 149.75JPY, corresponding to the 23.6% level, serving as a target for a rebound high.

The US Dollar Index is trending downward, and USD selling pressure continues. The strategy remains to sell on rebounds in USDJPY. The day trading plan is to place a sell limit order at 149.80JPY, set a take profit at 148.65JPY, and a stop loss at 150.30JPY.

Support/Resistance lines

Key support and resistance lines to consider:

  • 149.25JPY – Recent low / Fibonacci level
  • 148.65JPY – Major low
[USDJPY / H1]

Market Sentiment

USDJPY – Sell: 22% / Buy: 78%

Today’s important economic indicators

Economic Indicators and EventsJapan Time
Japanese Holiday (Stock Market Closed)–
German Federal Election–
EU Consumer Price Index19:00
Speech by Bank of England Committee Member22:15

*Trading advice in this article is not provided by Milton Markets, but by Shu Fujiyasu Jr., a certified technical analyst.

Ready to trade?

Open live account

Related Analysis

Can Gold Renew Its Record High?

Can Gold Renew Its Record High?

10 days agoRead more →
No Currency Intervention Conducted; Reports of Additional Tariffs on South Korea

No Currency Intervention Conducted; Reports of Additional Tariffs on South Korea

20 days agoRead more →
Gold and Silver Continue to Hit Record Highs

Gold and Silver Continue to Hit Record Highs

19 days agoRead more →

This material is for informational purposes only and does not constitute investment advice. Trading leveraged products involves significant risk of loss. Past performance is not indicative of future results.

Share

X

Start trading today

  • Fast execution
  • Competitive spreads
  • 24/7 support
Open live accountView account types
Milton Markets
Twitter/XYouTube

Markets

FOREX
CRYPTO
COMMODITIES
INDICES
STOCKS

Trading

  • Flex Account
  • Smart Account
  • Elite Account
  • MetaTrader 5 (MT5)
  • MetaTrader 4 (MT4)
  • Launch WebTrader
  • Learn Hub
  • Economic Calendar
  • Promotions

Company

  • About Us
  • NDD Technology
  • Customer Protection
  • Execution Conditions
  • Company News
  • Blog
  • Market Analysis

Partners

  • IB Program
  • PAMM Program
  • White Label
  • Investor Login
  • Manager Login

Support

  • Terms of Service
  • Privacy Policy
  • Risk Disclosure
  • Contact Us
  • Help Center
  • My Page Login
Milton Markets is a trading name of Milton Markets Ltd. Milton Markets Ltd. is part of Milton Global and is registered in Saint Lucia (Registration Number: 2023-00166). As part of Milton Global, we adhere to the same high regulatory standards as Milton Global Ltd, which is regulated by the Seychelles Financial Services Authority (FSA) under license SD040.
Risk Warning: CFD trading carries high risk and may not suit all investors. You may lose more than your initial investment. Ensure you understand the risks before trading.
Restrictions: Milton Markets does not provide services to the following countries (not limited to these): United States, Canada, European Union countries, Iran, North Korea, Saint Vincent and the Grenadines, Afghanistan, American Samoa, Belarus, Russia, Burundi, Central African Republic, Congo (Brazzaville), Cuba, Iraq, Lebanon, Liberia, Libya, Myanmar, Puerto Rico, Rwanda, Somalia, Sudan, Syria, US Virgin Islands, Venezuela, Yemen, Zimbabwe, Côte d'Ivoire, Mali, Guinea, Eritrea.
You must be 18 years old or the legal age in your country of residence.
By opening an account, you are considered to have registered of your own volition without solicitation from Milton Markets.
Disclaimer: This website does not constitute investment advice. Content should not be construed as personal advice. Seek independent financial advice.
© 2026 Milton Markets. All rights reserved.
TermsPrivacyCookiesRisk