Milton Markets
Markets
Trading
Company
Partners
Sign InOpen Account
  1. Home/
  2. Market Analysis/
  3. Gold Hits New All-Time High, Longest Bull Run Since 2020【February 25, 2025】
Koki Ando•Feb 25, 2025

Gold Hits New All-Time High, Longest Bull Run Since 2020【February 25, 2025】

Koki Ando headshot

Daily Market Analysis

Koki AndoChief Market Analyst

Expert analysis of today's market movements and trading opportunities

Koki Ando headshot

Daily Market Analysis

Koki AndoChief Market Analyst

Expert analysis of today's market movements and trading opportunities

Fundamental Analysis

  • Germany’s conservative opposition and far-right parties gain ground, dealing a blow to the current administration.
  • Gold has continued its uptrend for eight consecutive weeks, marking the longest bull run since 2020.

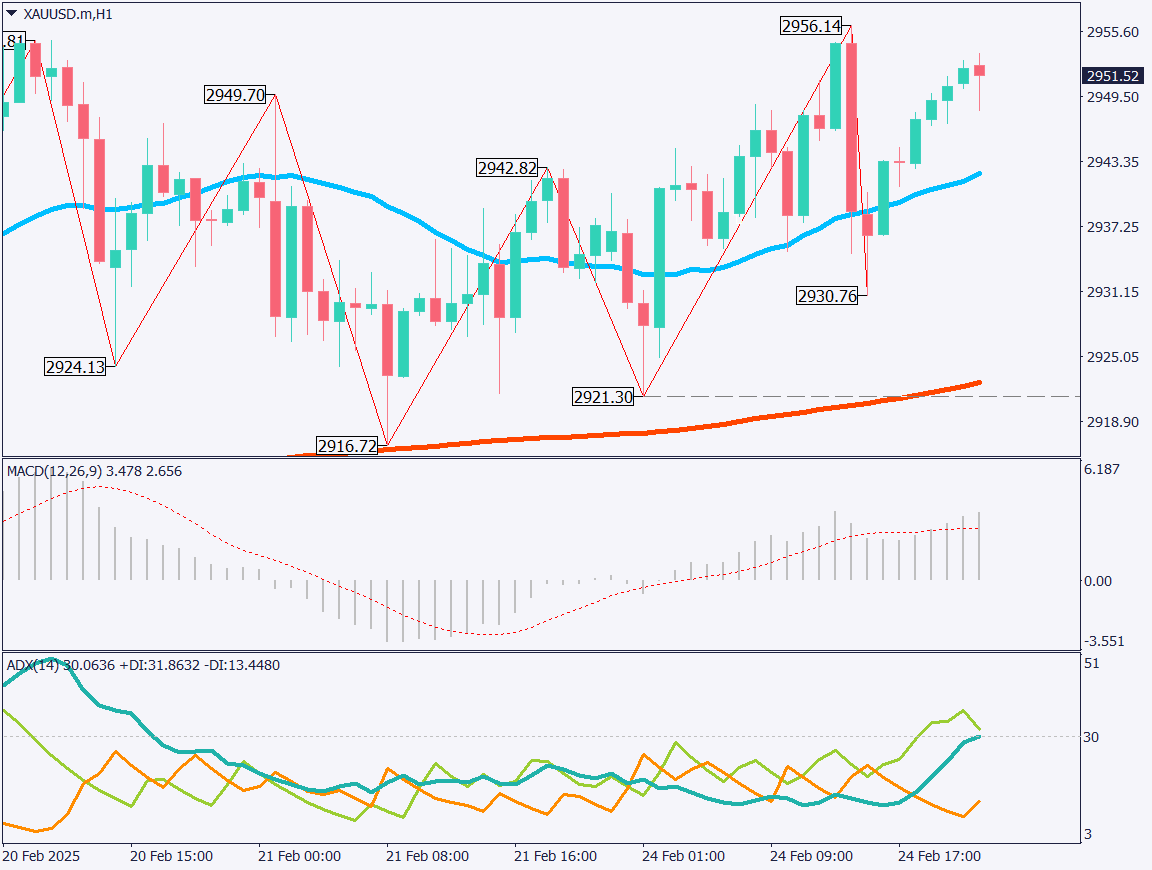
XAUUSD Technical Analysis

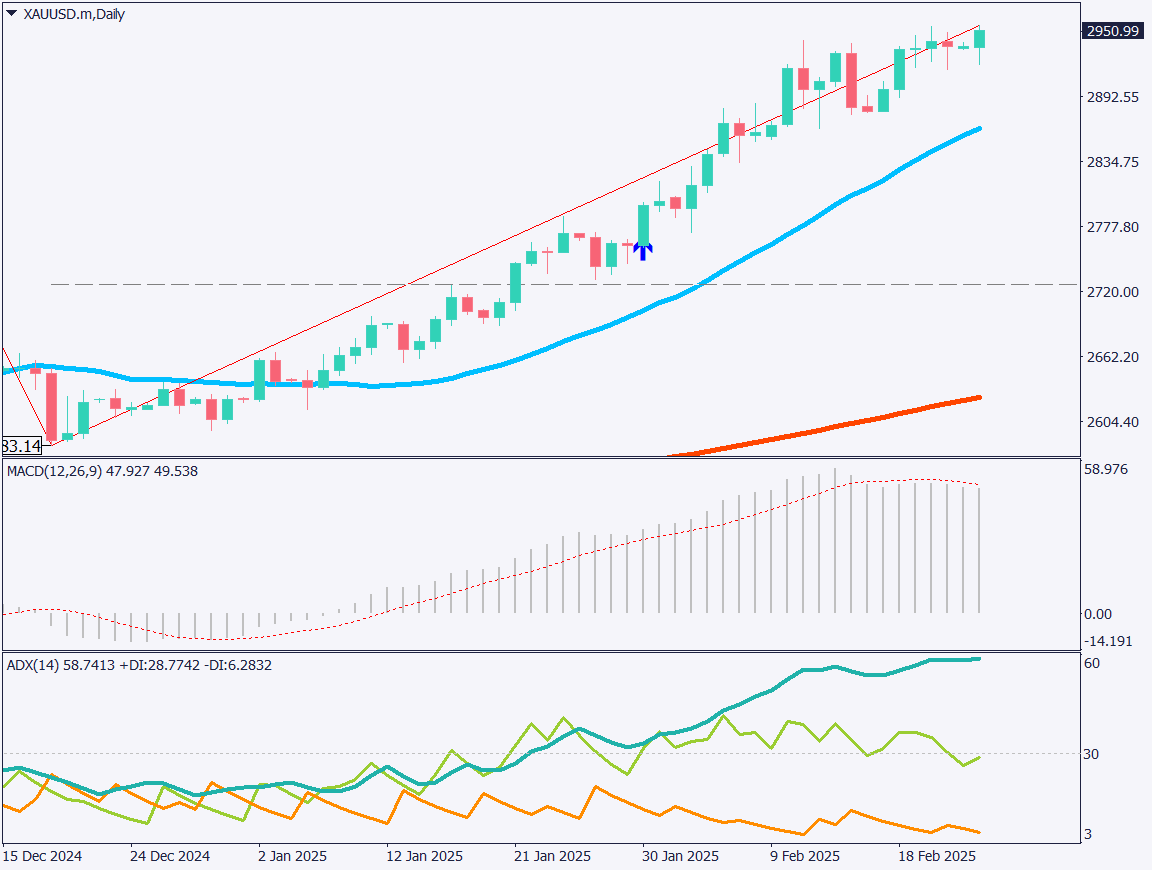
Analyzing the daily chart of gold, the bullish trend remains intact, with gold reaching a new all-time high of USD 2,956. On the weekly chart, gold is forming a band walk along the +2σ line of the Bollinger Bands, extending its winning streak to eight weeks. This marks the longest sustained uptrend since 2020.

The rally is driven by central bank purchases and increasing ETF holdings. ETF inflows have reached levels not seen since 2022, suggesting a shift of funds from the stock market into gold.

The daily ADX is approaching 60, but the +DI (Directional Indicator) has slightly declined to 24, signaling a potential pullback. A correction towards USD 2,870, where the 26-day moving average is positioned, could occur before further gains.

[XAUUSD / D1]

Day trading strategy (1 hour)

Analyzing the 1-hour gold chart, we see a range-bound market between USD 2,920 and USD 2,955. The USD 2,955 level is the projected monthly high for February.

Looking ahead to March, gold may test the USD 3,000 level. However, buying at high price zones should be avoided. It is advisable to wait for a pullback and consider entry points around the 10-day moving average at USD 2,924 or the 26-day moving average at USD 2,870. The target price for closing positions is USD 2,950, while a clear break below the moving averages should be used as a stop-loss.

Support/Resistance lines

Key support and resistance lines to consider:

  • USD 2,980 – Major resistance level
  • USD 2,955 – Monthly resistance level
[XAUUSD / H1]

Market Sentiment

XAUUSD Sell: 61% / Buy: 39%

Today’s important economic indicators

Economic Indicators and EventsJapan Time
BOJ Core CPI14:00
Germany GDP16:00
US Case-Shiller Home Price Index23:00
US Consumer Confidence Index00:00 (Midnight)
FOMC Member Bostic Speech02:00 (Midnight)

*Trading advice in this article is not provided by Milton Markets, but by Shu Fujiyasu Jr., a certified technical analyst.

Ready to trade?

Open live account

Related Analysis

USD/JPY Forms a Range — What’s Next?

USD/JPY Forms a Range — What’s Next?

TodayRead more →
USD/JPY: Selling Pressure Dominates on Rallies

USD/JPY: Selling Pressure Dominates on Rallies

6 days agoRead more →
USD/JPY dips slightly on LDP landslide victory

USD/JPY dips slightly on LDP landslide victory

7 days agoRead more →

This material is for informational purposes only and does not constitute investment advice. Trading leveraged products involves significant risk of loss. Past performance is not indicative of future results.

Share

X

Start trading today

  • Fast execution
  • Competitive spreads
  • 24/7 support
Open live accountView account types
Milton Markets
Twitter/XYouTube

Markets

FOREX
CRYPTO
COMMODITIES
INDICES
STOCKS

Trading

  • Flex Account
  • Smart Account
  • Elite Account
  • MetaTrader 5 (MT5)
  • MetaTrader 4 (MT4)
  • Launch WebTrader
  • Learn Hub
  • Economic Calendar
  • Promotions

Company

  • About Us
  • NDD Technology
  • Customer Protection
  • Execution Conditions
  • Company News
  • Blog
  • Market Analysis

Partners

  • IB Program
  • PAMM Program
  • White Label
  • Investor Login
  • Manager Login

Support

  • Terms of Service
  • Privacy Policy
  • Risk Disclosure
  • Contact Us
  • Help Center
  • My Page Login
Milton Markets is a trading name of Milton Markets Ltd. Milton Markets Ltd. is part of Milton Global and is registered in Saint Lucia (Registration Number: 2023-00166). As part of Milton Global, we adhere to the same high regulatory standards as Milton Global Ltd, which is regulated by the Seychelles Financial Services Authority (FSA) under license SD040.
Risk Warning: CFD trading carries high risk and may not suit all investors. You may lose more than your initial investment. Ensure you understand the risks before trading.
Restrictions: Milton Markets does not provide services to the following countries (not limited to these): United States, Canada, European Union countries, Iran, North Korea, Saint Vincent and the Grenadines, Afghanistan, American Samoa, Belarus, Russia, Burundi, Central African Republic, Congo (Brazzaville), Cuba, Iraq, Lebanon, Liberia, Libya, Myanmar, Puerto Rico, Rwanda, Somalia, Sudan, Syria, US Virgin Islands, Venezuela, Yemen, Zimbabwe, Côte d'Ivoire, Mali, Guinea, Eritrea.
You must be 18 years old or the legal age in your country of residence.
By opening an account, you are considered to have registered of your own volition without solicitation from Milton Markets.
Disclaimer: This website does not constitute investment advice. Content should not be construed as personal advice. Seek independent financial advice.
© 2026 Milton Markets. All rights reserved.
TermsPrivacyCookiesRisk