Milton Markets
Markets
Trading
Company
Partners
Sign InOpen Account
  1. Home/
  2. Market Analysis/
  3. USDJPY Drops to Mid-148 JPY as U.S. Consumer Confidence Index Deteriorates【February 26, 2025】
Koki Ando•Feb 26, 2025

USDJPY Drops to Mid-148 JPY as U.S. Consumer Confidence Index Deteriorates【February 26, 2025】

Koki Ando headshot

Daily Market Analysis

Koki AndoChief Market Analyst

Expert analysis of today's market movements and trading opportunities

Koki Ando headshot

Daily Market Analysis

Koki AndoChief Market Analyst

Expert analysis of today's market movements and trading opportunities

Fundamental Analysis

  • The U.S. Consumer Confidence Index declined, leading to continued drops in U.S. stock indices.
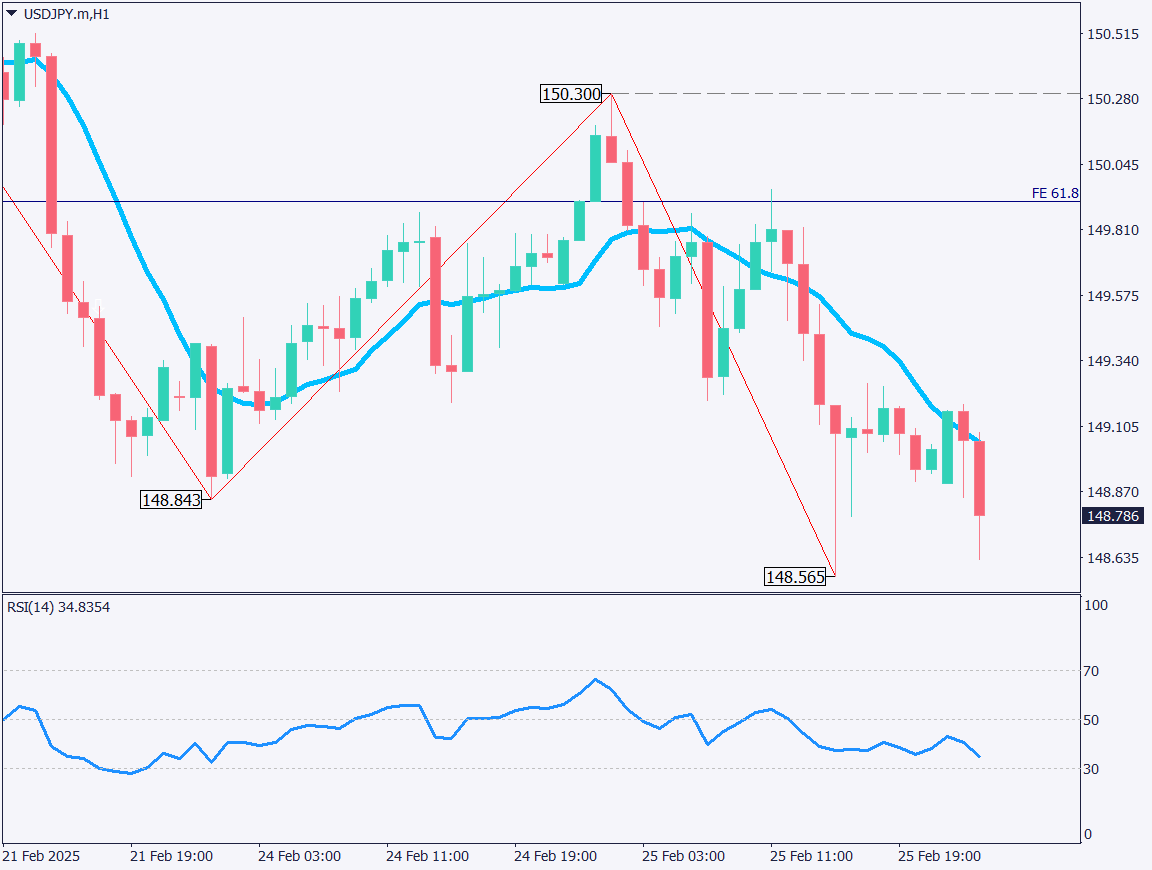
  • USDJPY shows a strong yen appreciation trend, fluctuating in the mid-148 JPY range.

USDJPY Technical Analysis

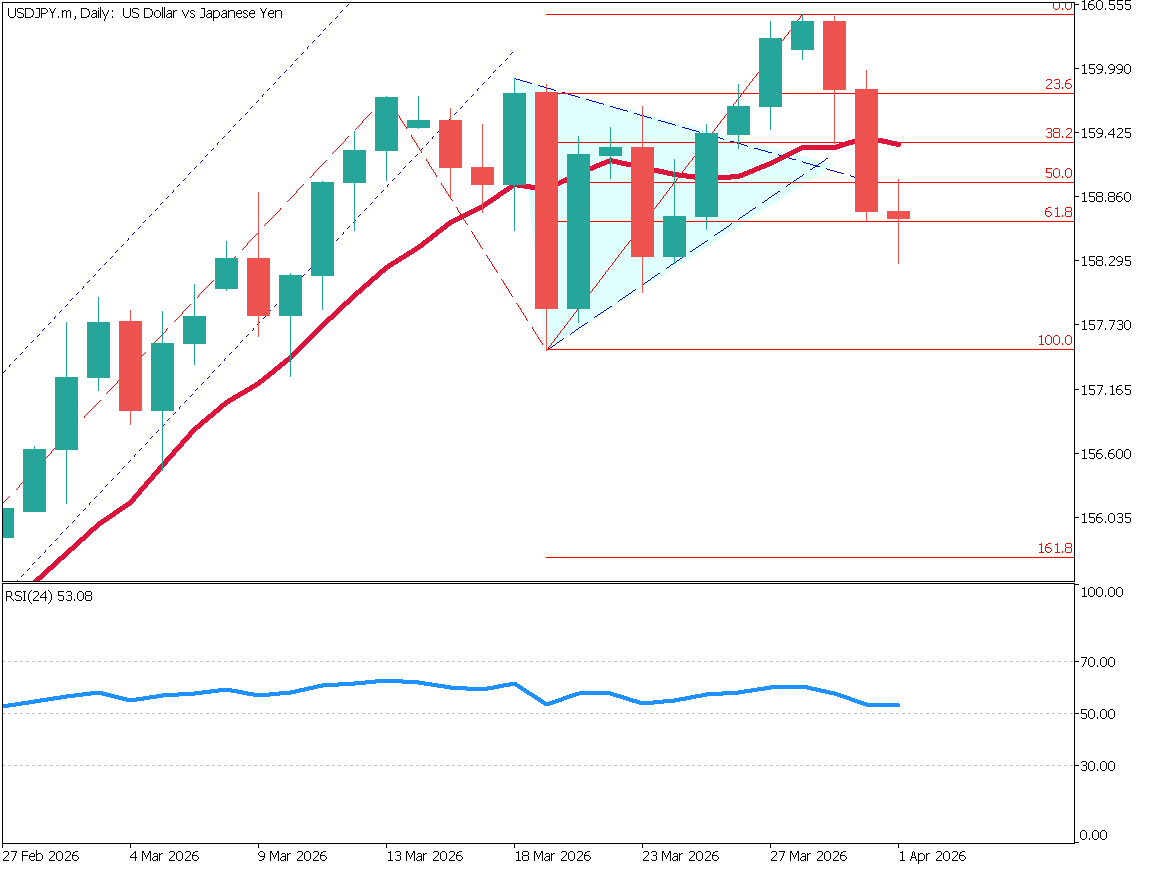
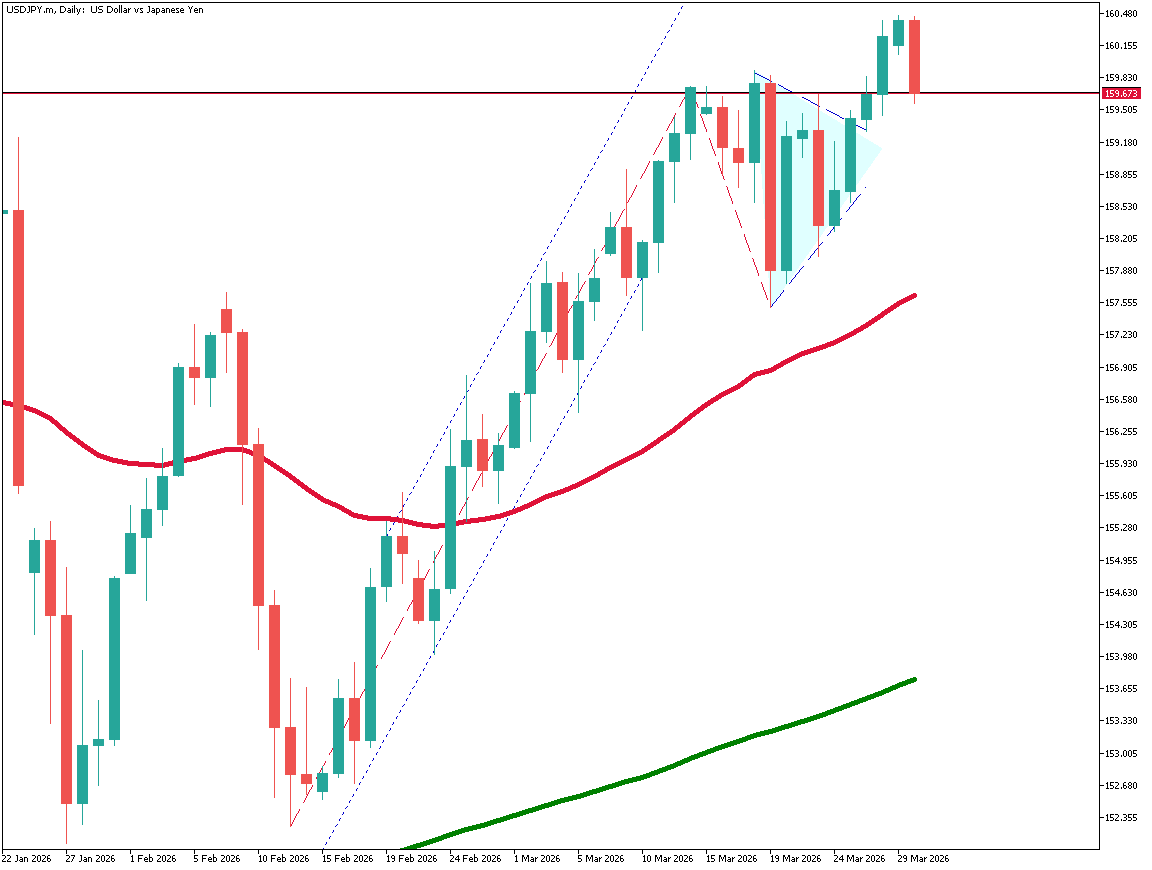
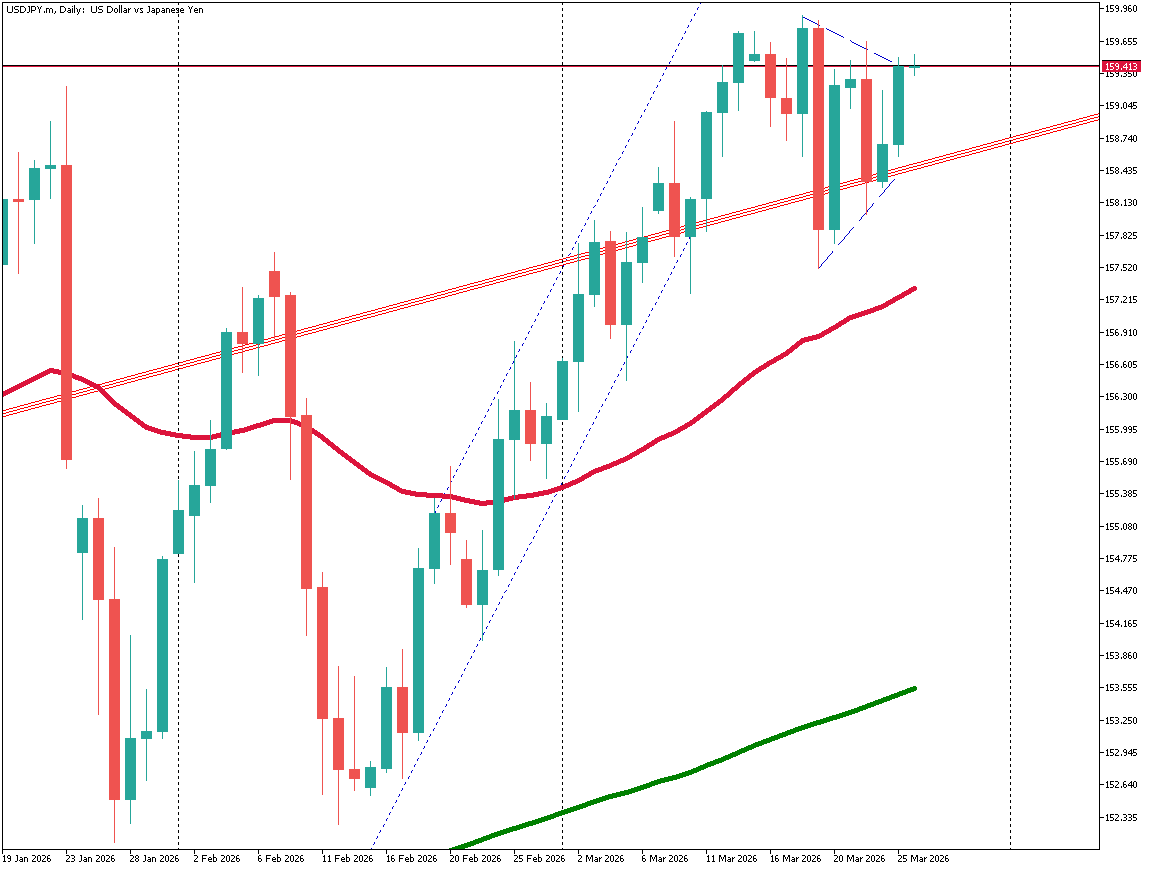
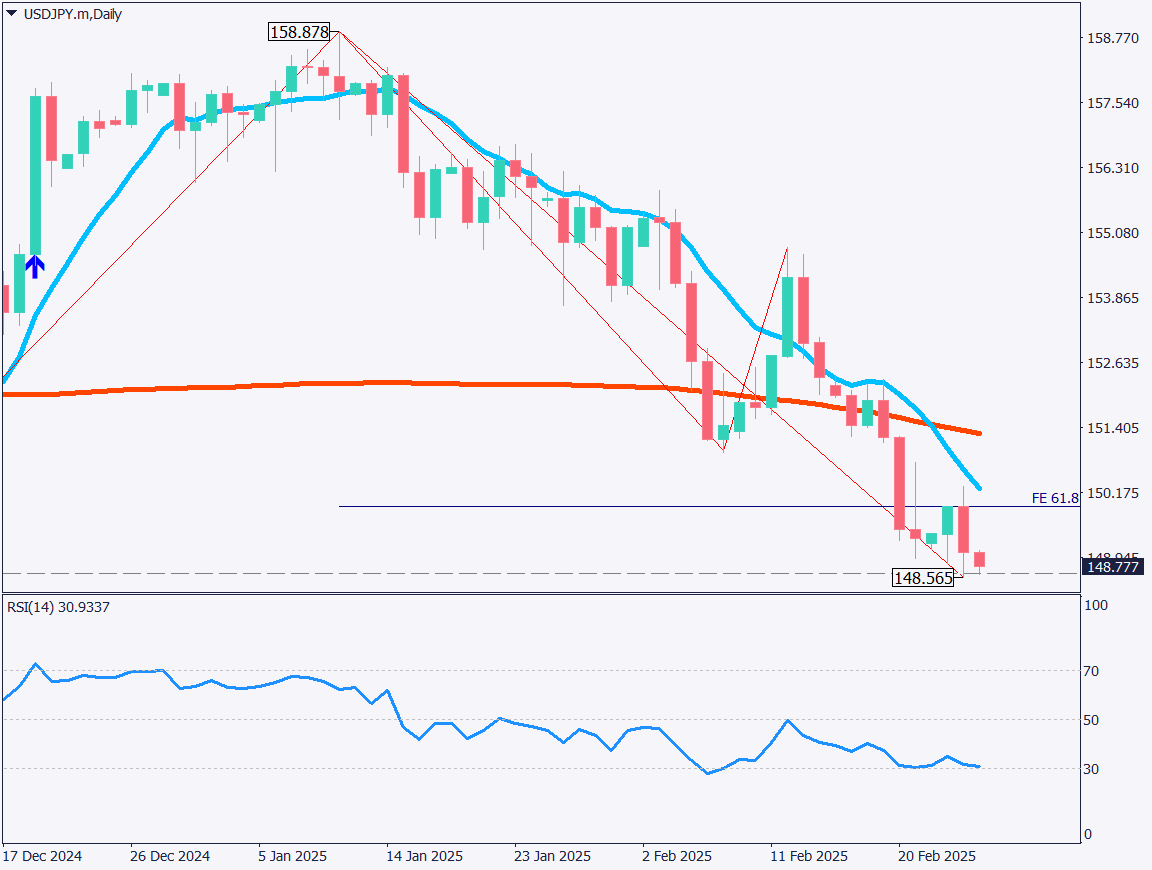
Analyzing the daily chart of USDJPY, the 200-day moving average has started to turn downward. Additionally, a death cross has formed with the 10-day moving average, reinforcing the downtrend. The 61.8% Fibonacci Expansion level is acting as a strong resistance, with the recent rebound high forming precisely at this level. The 100% Fibonacci Expansion level corresponds to 146.85 JPY, while the 161.8% level aligns with the 142 JPY range. U.S. stock prices are declining, and concerns over a weakening U.S. economy are gradually spreading in the market.

From July to September last year, USDJPY also experienced a yen appreciation phase, dropping to 139 JPY. This time, economic indicators have worsened, with concerns over U.S. tariffs and significant reductions in federal employees adding to economic uncertainty. There is a possibility of a second significant yen appreciation phase, making it necessary to remain cautious.

[USDJPY / D1]

Day trading strategy (1 hour)

On the 1-hour chart, the 10-period moving average has become a key level, and a strong downward trend is evident. USDJPY has already declined to 148.55 JPY and is expected to continue falling towards the 100% Fibonacci Expansion level at 146.85 JPY. A bearish engulfing candlestick pattern has also appeared on the daily chart, indicating strong selling pressure. Traders should look for opportunities to enter short positions while being mindful of potential retracements.

For a day trading approach, a market order entry is one option, but since RSI is at 30, waiting for a slight rebound before entering may be more effective. If the price rises above 150.25 JPY, a stop-loss should be placed, while the profit target should be set at 146.85 JPY.

Support/Resistance lines

Key support and resistance lines to consider:

  • 147.80 JPY – Monthly support level
[USDJPY / H1]

Market Sentiment

USDJPY – Sell: 36% / Buy: 64%

Today’s important economic indicators

Economic Indicators and EventsJapan Time
Germany Consumer Confidence Index16:00

*Trading advice in this article is not provided by Milton Markets, but by Shu Fujiyasu Jr., a certified technical analyst.

Ready to trade?

Open live account

Related Analysis

USD/JPY dips slightly on LDP landslide victory

USD/JPY dips slightly on LDP landslide victory

7 days agoRead more →
USD/JPY Forms a Range — What’s Next?

USD/JPY Forms a Range — What’s Next?

TodayRead more →
No Currency Intervention Conducted; Reports of Additional Tariffs on South Korea

No Currency Intervention Conducted; Reports of Additional Tariffs on South Korea

20 days agoRead more →

This material is for informational purposes only and does not constitute investment advice. Trading leveraged products involves significant risk of loss. Past performance is not indicative of future results.

Share

X

Start trading today

  • Fast execution
  • Competitive spreads
  • 24/7 support
Open live accountView account types
Milton Markets
Twitter/XYouTube

Markets

FOREX
CRYPTO
COMMODITIES
INDICES
STOCKS

Trading

  • Flex Account
  • Smart Account
  • Elite Account
  • MetaTrader 5 (MT5)
  • MetaTrader 4 (MT4)
  • Launch WebTrader
  • Learn Hub
  • Economic Calendar
  • Promotions

Company

  • About Us
  • NDD Technology
  • Customer Protection
  • Execution Conditions
  • Company News
  • Blog
  • Market Analysis

Partners

  • IB Program
  • PAMM Program
  • White Label
  • Investor Login
  • Manager Login

Support

  • Terms of Service
  • Privacy Policy
  • Risk Disclosure
  • Contact Us
  • Help Center
  • My Page Login
Milton Markets is a trading name of Milton Markets Ltd. Milton Markets Ltd. is part of Milton Global and is registered in Saint Lucia (Registration Number: 2023-00166). As part of Milton Global, we adhere to the same high regulatory standards as Milton Global Ltd, which is regulated by the Seychelles Financial Services Authority (FSA) under license SD040.
Risk Warning: CFD trading carries high risk and may not suit all investors. You may lose more than your initial investment. Ensure you understand the risks before trading.
Restrictions: Milton Markets does not provide services to the following countries (not limited to these): United States, Canada, European Union countries, Iran, North Korea, Saint Vincent and the Grenadines, Afghanistan, American Samoa, Belarus, Russia, Burundi, Central African Republic, Congo (Brazzaville), Cuba, Iraq, Lebanon, Liberia, Libya, Myanmar, Puerto Rico, Rwanda, Somalia, Sudan, Syria, US Virgin Islands, Venezuela, Yemen, Zimbabwe, Côte d'Ivoire, Mali, Guinea, Eritrea.
You must be 18 years old or the legal age in your country of residence.
By opening an account, you are considered to have registered of your own volition without solicitation from Milton Markets.
Disclaimer: This website does not constitute investment advice. Content should not be construed as personal advice. Seek independent financial advice.
© 2026 Milton Markets. All rights reserved.
TermsPrivacyCookiesRisk