U.S. Attacks Venezuela, Gold Sees a Buyback Move

Daily Market Analysis
Expert analysis of today's market movements and trading opportunities
Daily Market Analysis
Expert analysis of today's market movements and trading opportunities
Fundamental Analysis
- The United States launched an attack on Venezuela, detaining the president and transferring him to the U.S.
- This action has drawn both criticism and support from various countries, raising global geopolitical risk
- Today marks the first trading day of the year in Japan, with the Nikkei Average starting higher
Precious Metals Rebound
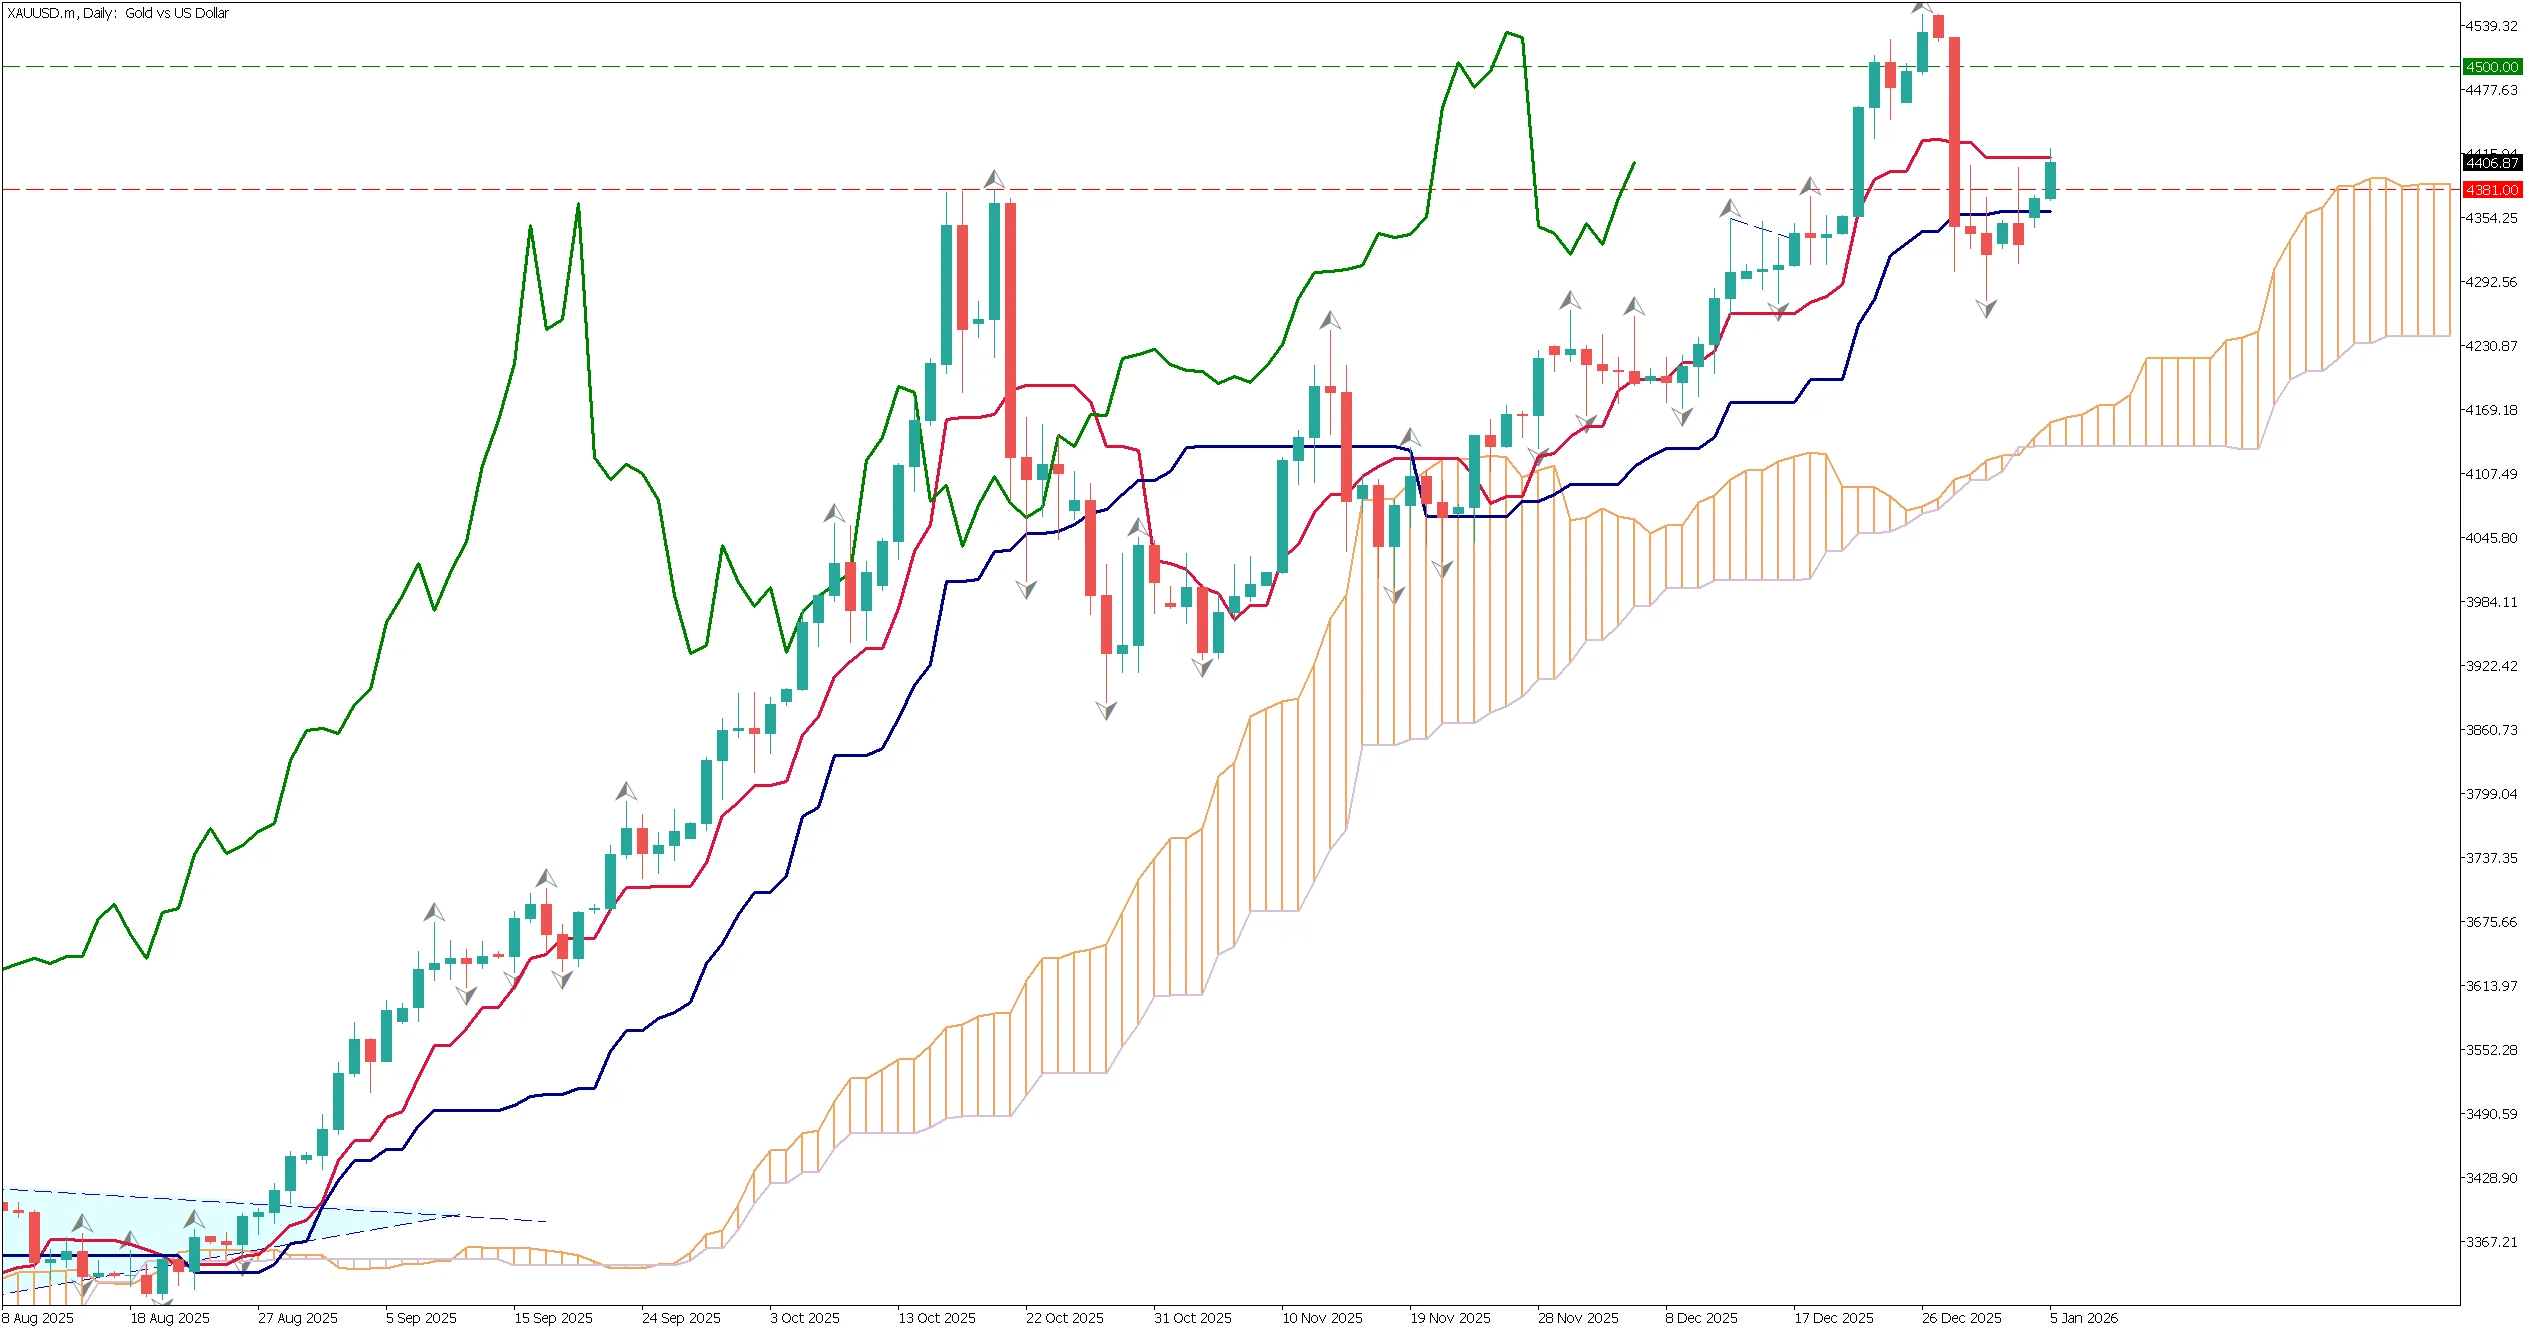
Precious metals, including gold, are seeing a rapid buyback. The sharp decline at the end of last year was reportedly caused by an increase in CME margin requirements. As prices fell, traders who had missed the earlier uptrend entered the market on dips.
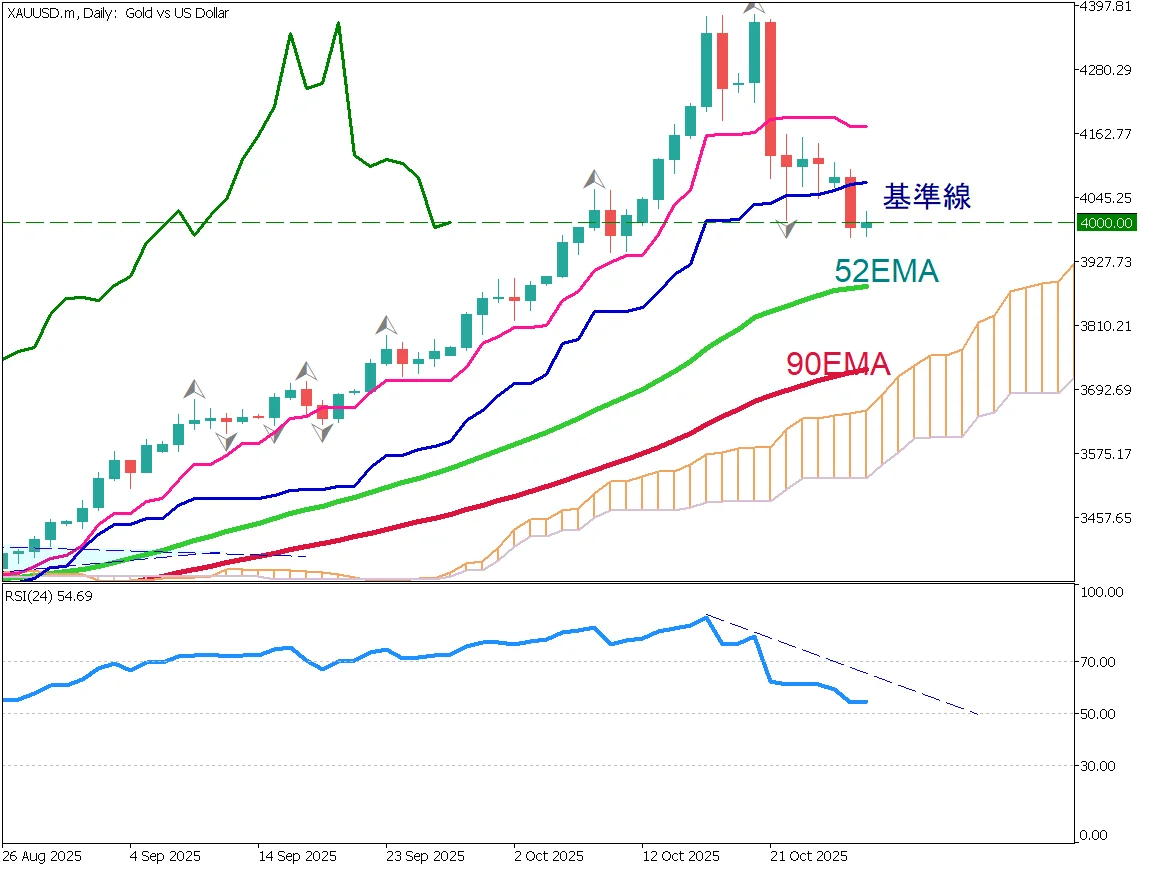
Gold is currently trading in the $4,400 range, with the Ichimoku conversion line acting as resistance. There are few clear reasons for a sharp decline, and rising geopolitical risk suggests a gradual upward move. Attention is on whether prices can break above the conversion line and continue the uptrend.
Rebound from $4,300
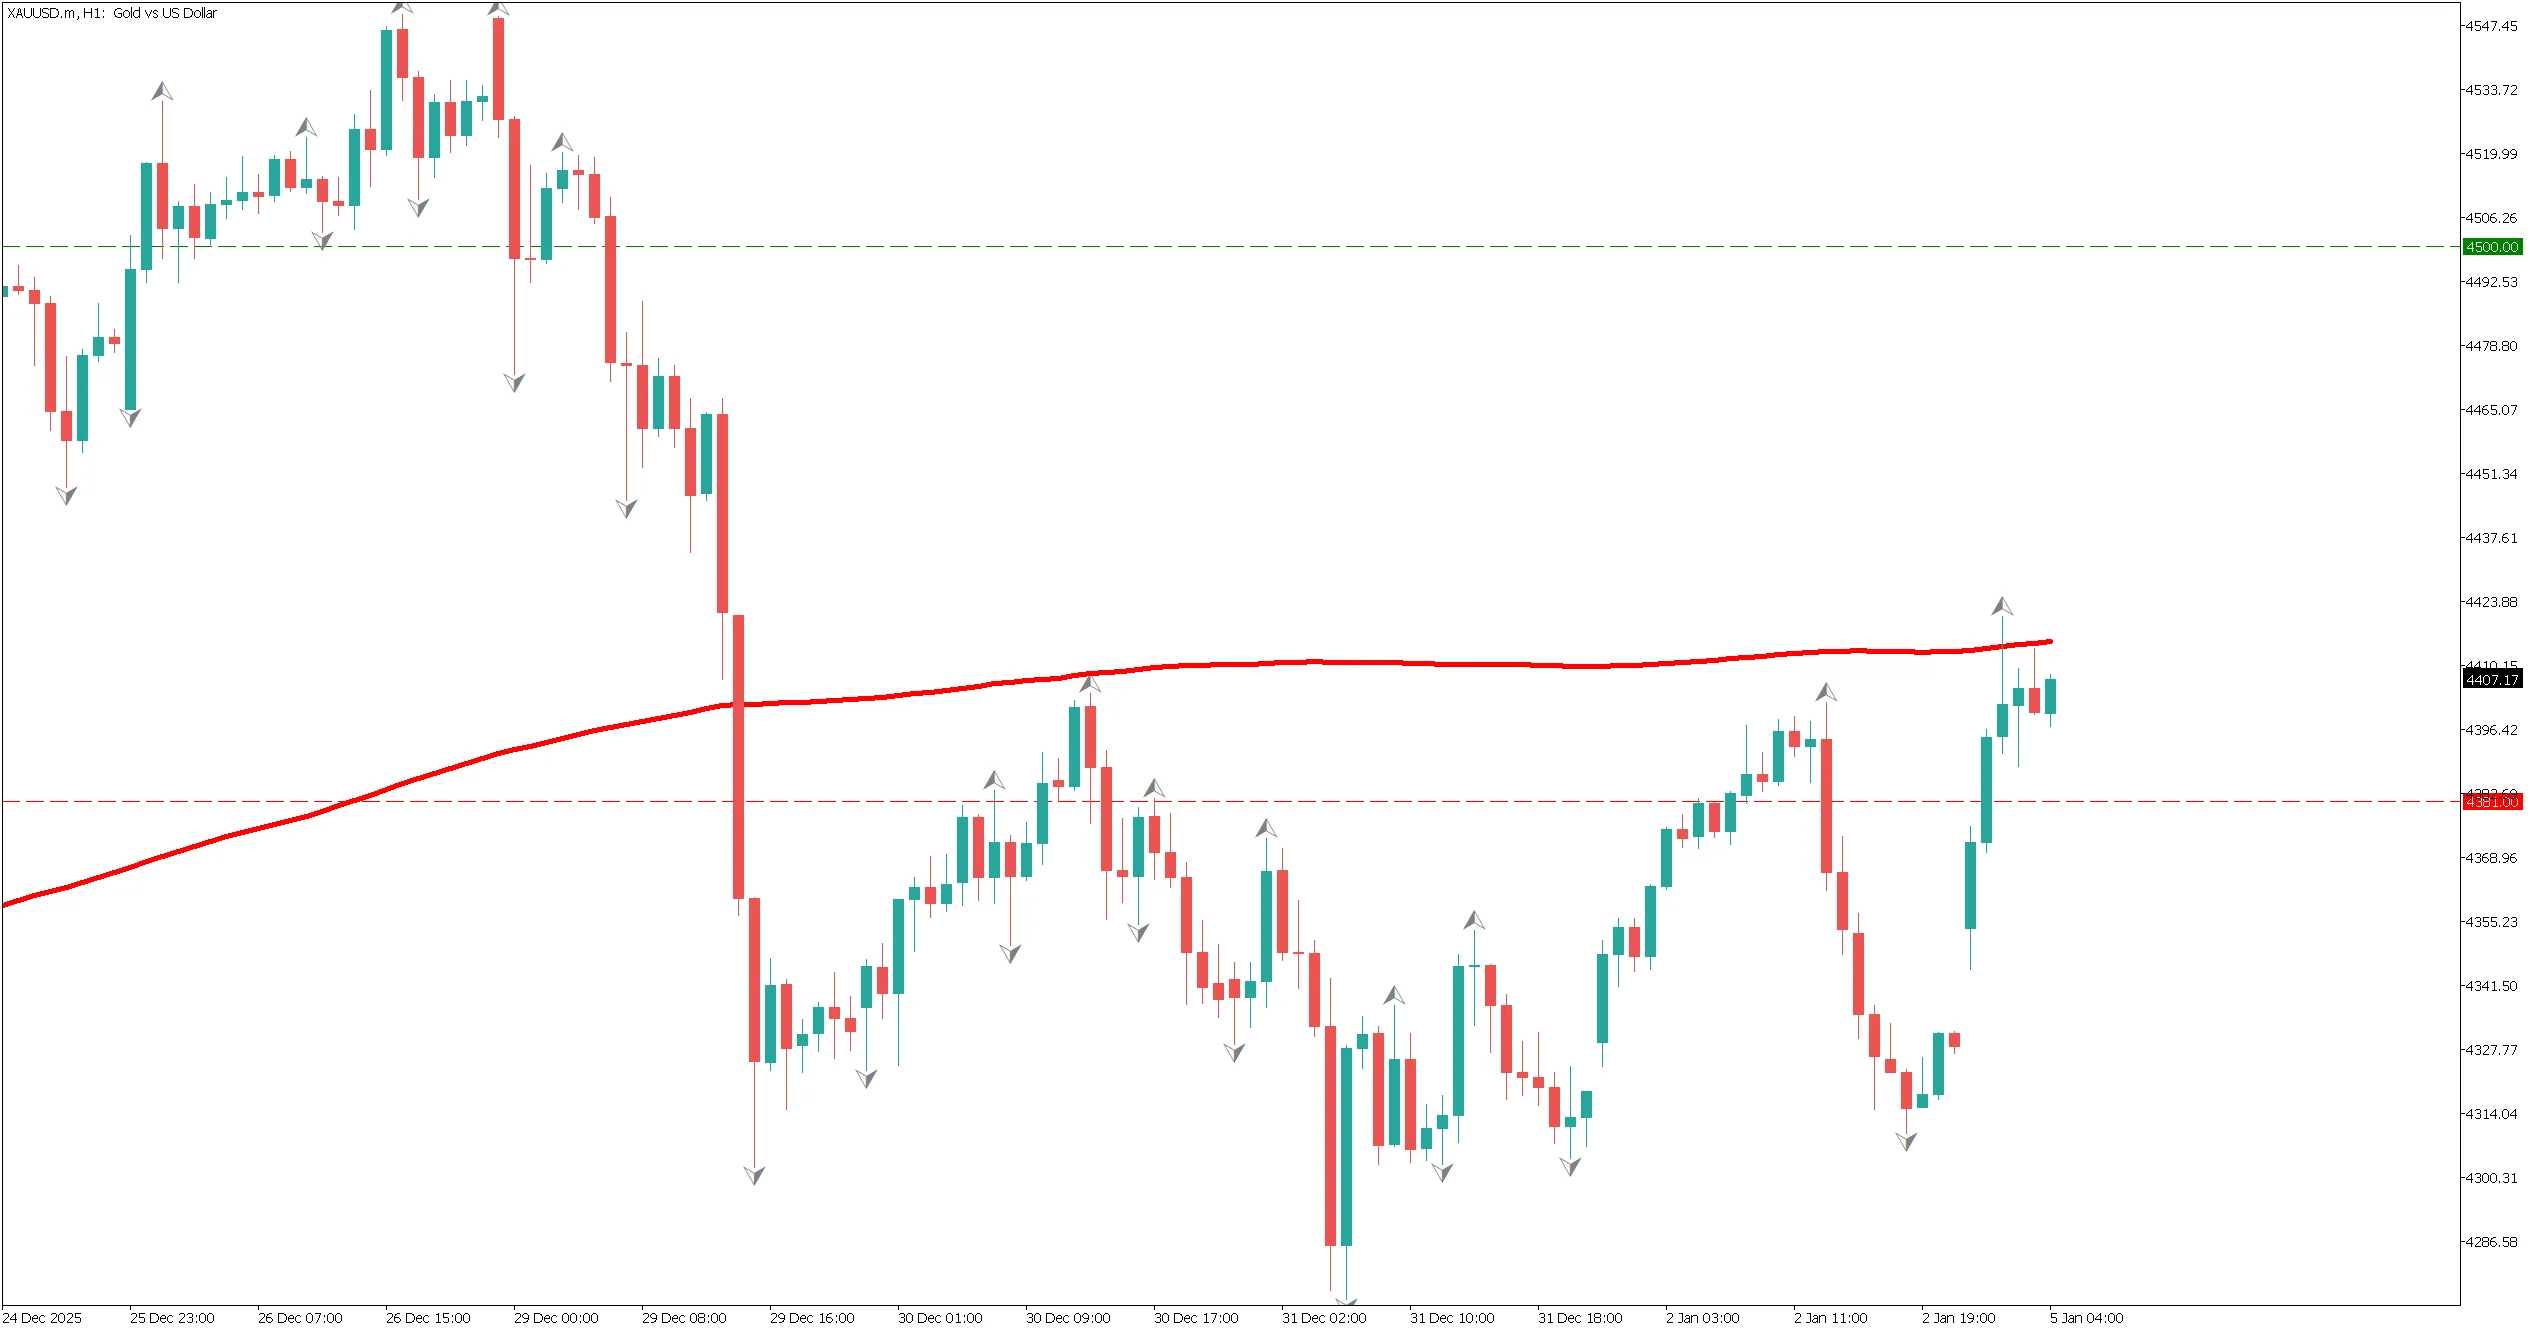
Looking at the 1-hour chart, the 200-period moving average is functioning as resistance. An inverse head-and-shoulders pattern can be observed. If gold rebounds from $4,300 and breaks above the 200-period moving average, a sharp rally beyond the neckline becomes possible.
The 200-period moving average remains effective even on the 1-hour timeframe.
The $4,500 level is expected to be a key psychological resistance. Broad U.S. dollar selling supports a gradual rise in gold prices.
For day trading, buying opportunities can be considered after confirming a break above the 200-period moving average. Approaches toward $4,300 may offer attractive pullback entries. However, if prices fall below $4,274, which corresponds to the head of the pattern, stopping out and waiting would be prudent.
Key Events Today
| Event | Time |
|---|---|
| Japan: First Trading Day of the Year | 9:30 AM |
Ready to trade?
Open live accountRelated Analysis
Gold Rises Further as U.S. Rate Cuts Accelerate
U.S. interest rate cuts continue to support gold prices. A rare "cup with handle" pattern has appeared on the gold chart, suggesting potential for further gains toward $4,400.
Can Gold Maintain the $4,000 Level?
Federal Reserve Governor Waller advocated for a rate cut in December, citing a weakening labor market. In Japan, despite the holiday, the yen continues to weaken gradually.
Gold Falls Below $4,000 as Risk-Off Sentiment Eases
Gold briefly fell below $4,000 as risk-off sentiment eased after the U.S.–China trade agreement. The metal is correcting after a sharp rally, with potential support near $3,955 and $3,880.
This material is for informational purposes only and does not constitute investment advice. Trading leveraged products involves significant risk of loss. Past performance is not indicative of future results.