USD/JPY in Consolidation: Unexpected Chaos in the Expanding Oil

Daily Market Analysis
Expert analysis of today's market movements and trading opportunities
Daily Market Analysis
Expert analysis of today's market movements and trading opportunities
Fundamental Analysis
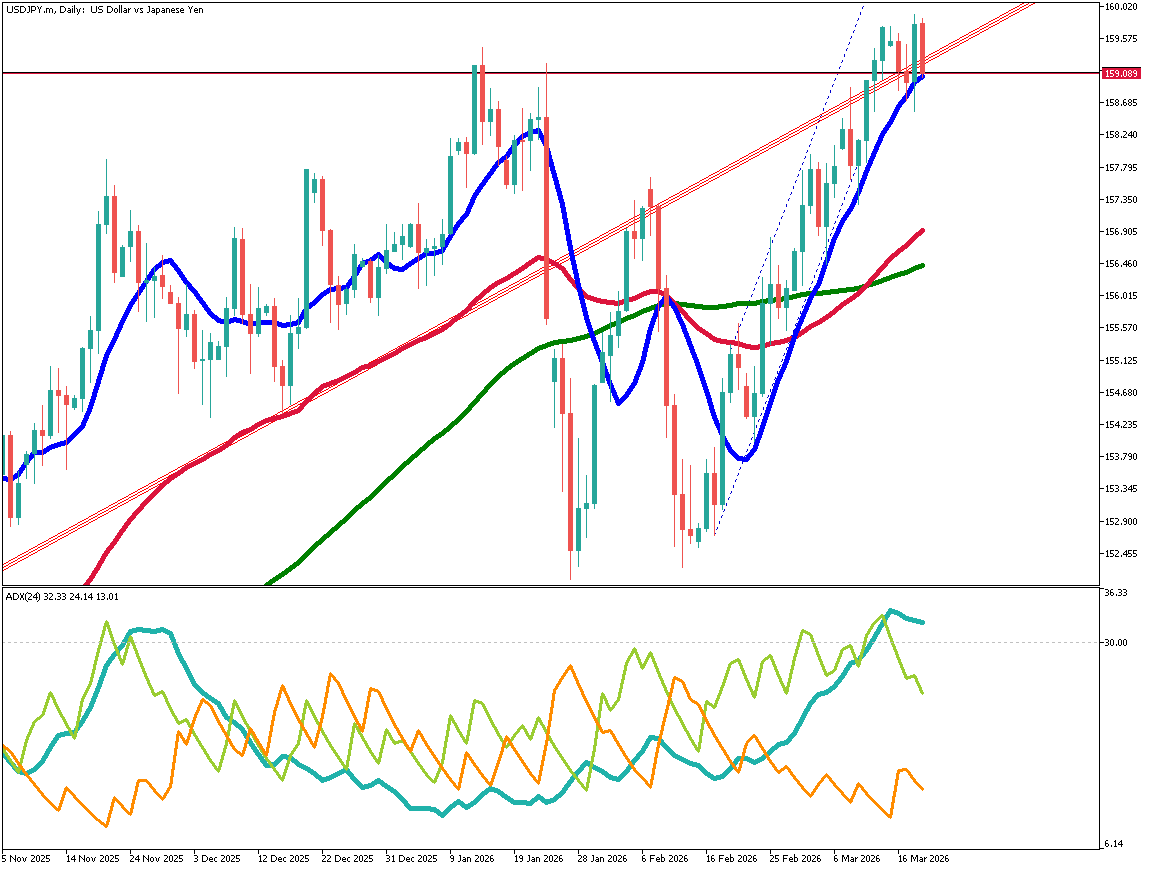
- USD/JPY, which had been forming a triangle consolidation pattern, is now showing signs of an upside breakout, trading in the mid-159 yen range. A "golden cross"—where the 52-day moving average crosses above the 200-day line—suggests a continuation of the upward trend. This is supported by high crude oil prices linked to the situation in Israel. Despite caution regarding potential currency intervention, the downside remains firm. Technically, the pair is expected to break above 160 yen, targeting approximately 162.15 yen, favoring a buy-on-dip strategy.
Aiming for Highs with Rising Lows Analyzing the USD/JPY daily chart, the pair is currently in a "triangle consolidation" phase, representing a brief pause. However, it is presently trading in the mid-159 yen range, with selling pressure on the yen intensifying. Although the pair retreated twice after approaching 160 yen, the downside remains firm. A regression line based on standard deviation channels shows an upward slope, suggesting the market is looking for the right timing to break above 160 yen.
The crude oil market, a primary driver of yen weakness, shows no signs of the chaos subsiding. Even if the U.S. and Iran move toward easing tensions or achieving a ceasefire, as long as Israel is involved, there is constant anxiety that any truce could be abandoned. It seems unlikely that oil prices will drop easily.
While oil is not the only factor weakening the yen, it is a significant one. Actual currency intervention remains difficult to implement. Predicting a move to break 160 yen, a strategy of buying at lower price points (picking up the lows) appears favorable.
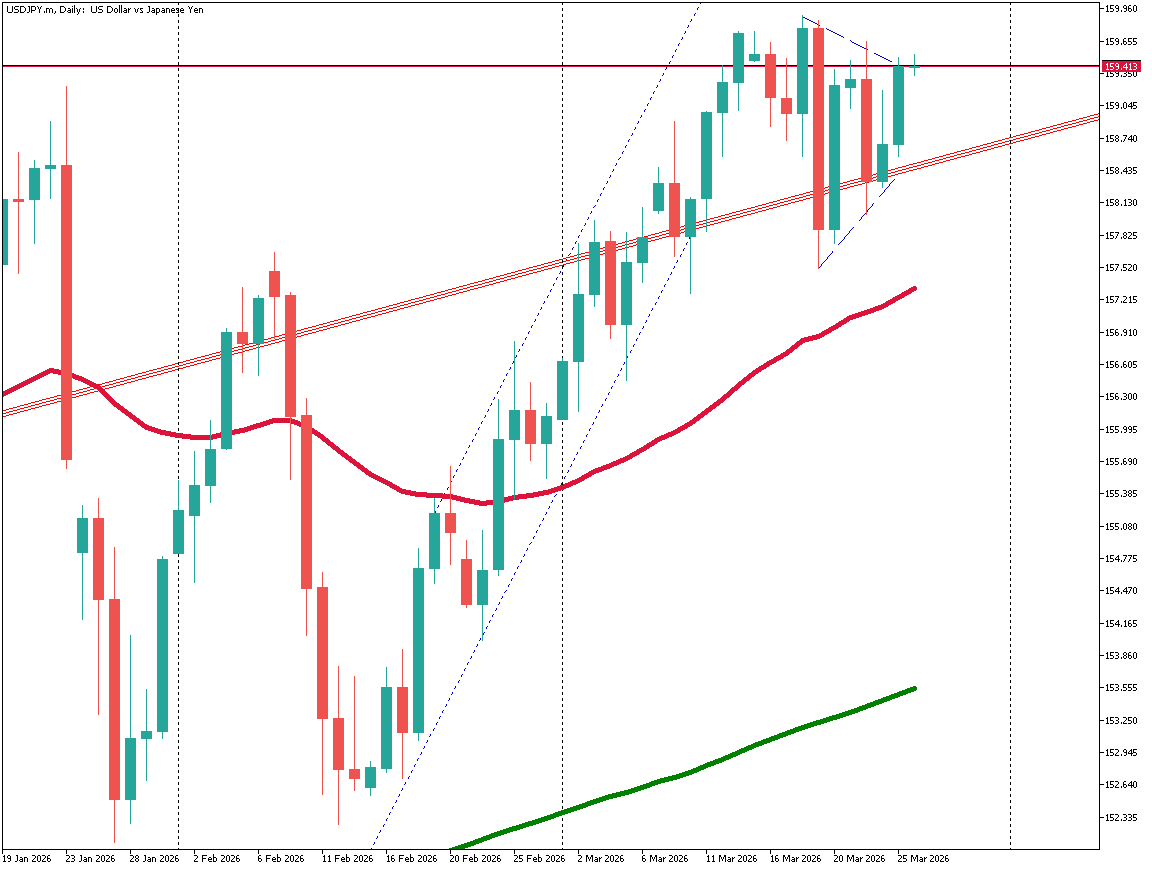
[USD/JPY / Daily Chart]
Breaking the Triangle? The pair had been forming a consolidation triangle with lower highs and higher lows, but it now appears to have broken above the upper resistance. Unless it immediately retreats back inside the pattern, a breakout above 160 yen is possible.
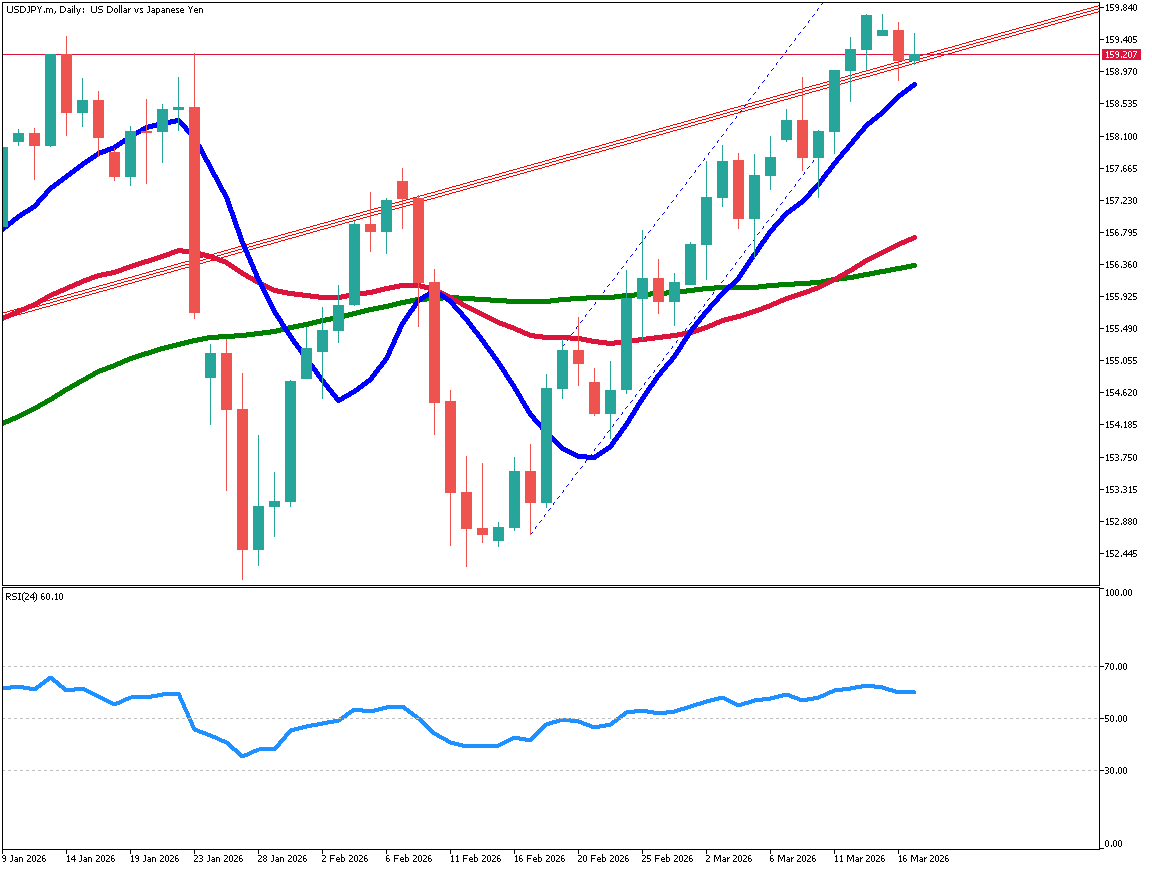
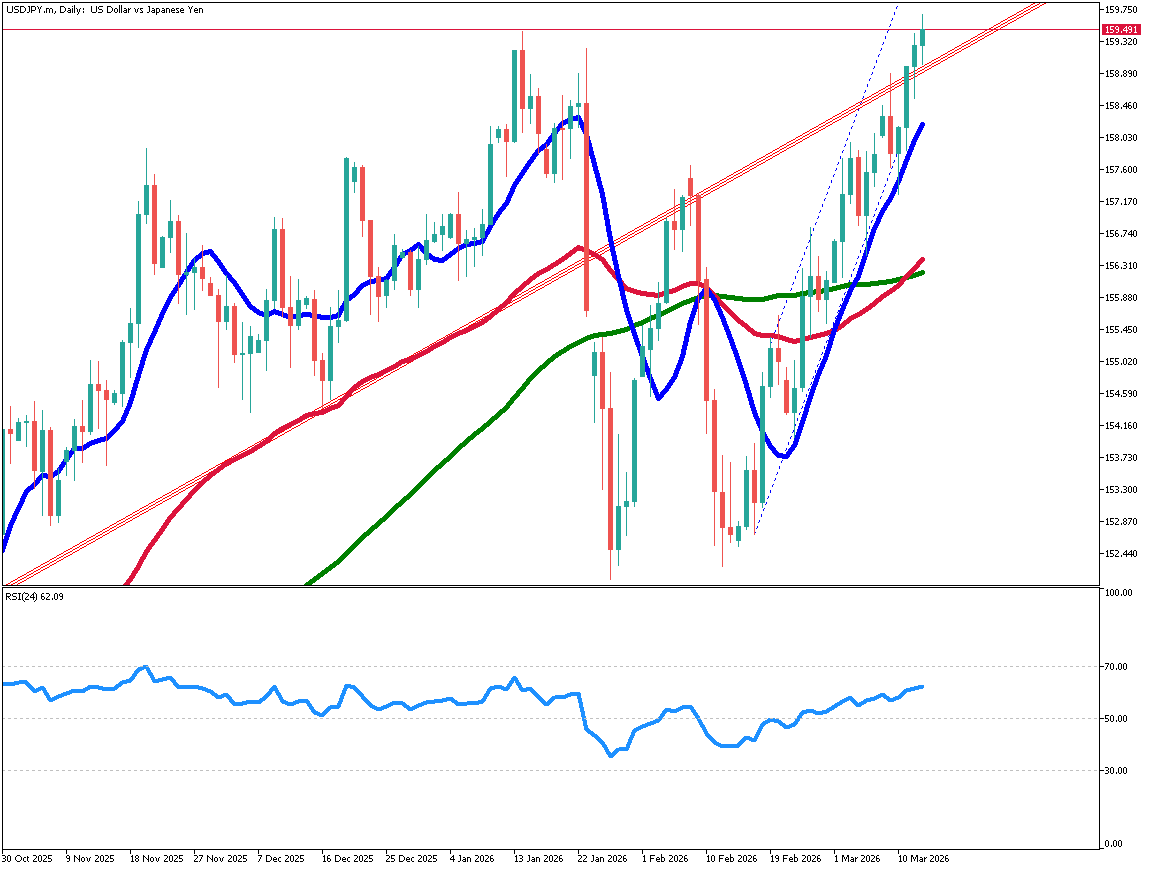
The 52-period moving average has crossed above the 200-period moving average, forming a "golden cross." If this triangle indicates a trend continuation, the target price would be around 162.15 yen.
At the very least, I intend to trade with a buy-on-dip strategy for the time being.
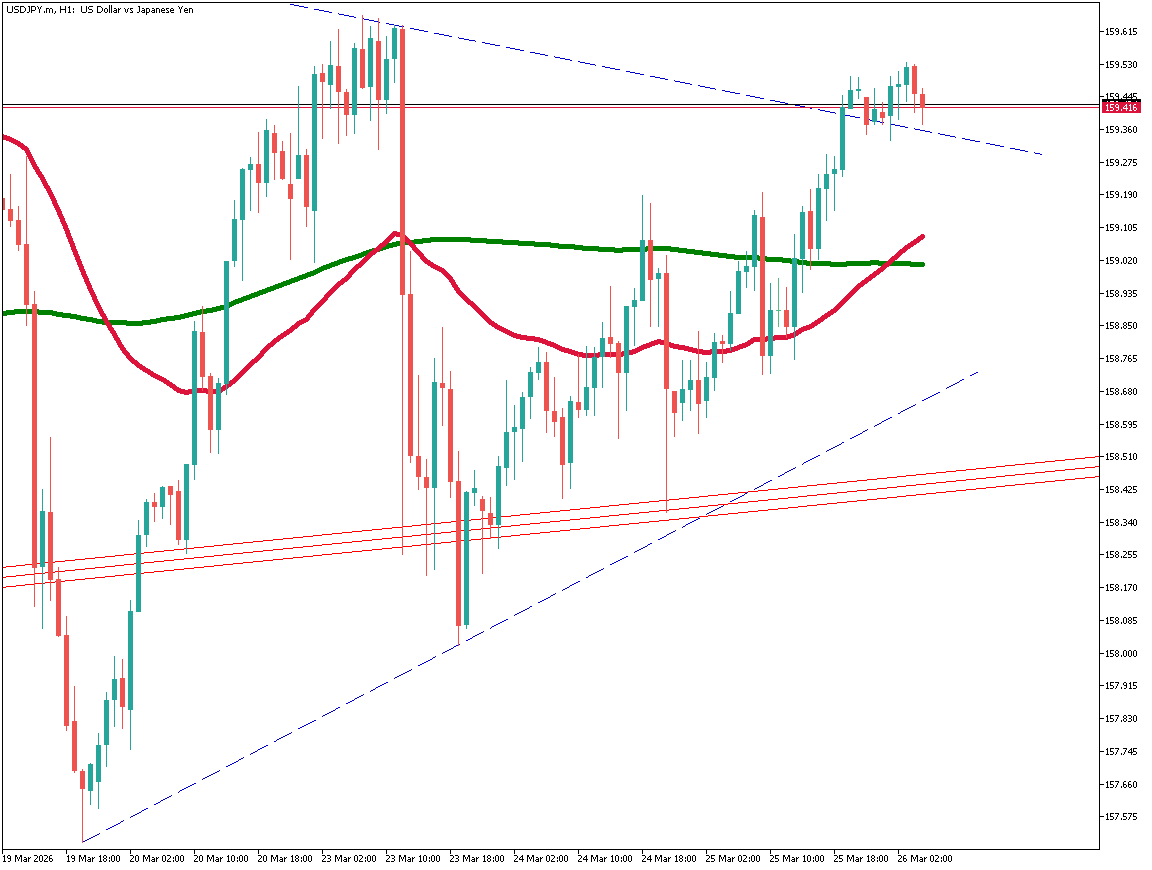
[USD/JPY / 1-Hour Chart]
Ready to trade?
Open live accountRelated Analysis
This material is for informational purposes only and does not constitute investment advice. Trading leveraged products involves significant risk of loss. Past performance is not indicative of future results.