USD/JPY Nears 160, Yen Weakens on "Takaichi Trade"

Daily Market Analysis
Expert analysis of today's market movements and trading opportunities
Daily Market Analysis
Expert analysis of today's market movements and trading opportunities
Fundamental Analysis
- Reports that Prime Minister Takaichi plans a snap dissolution of the House of Representatives at the opening of the Diet session have accelerated yen selling
- USD/JPY is nearing 160, forming a "Takaichi market" characterized by rising stocks, a weaker yen, and falling bonds
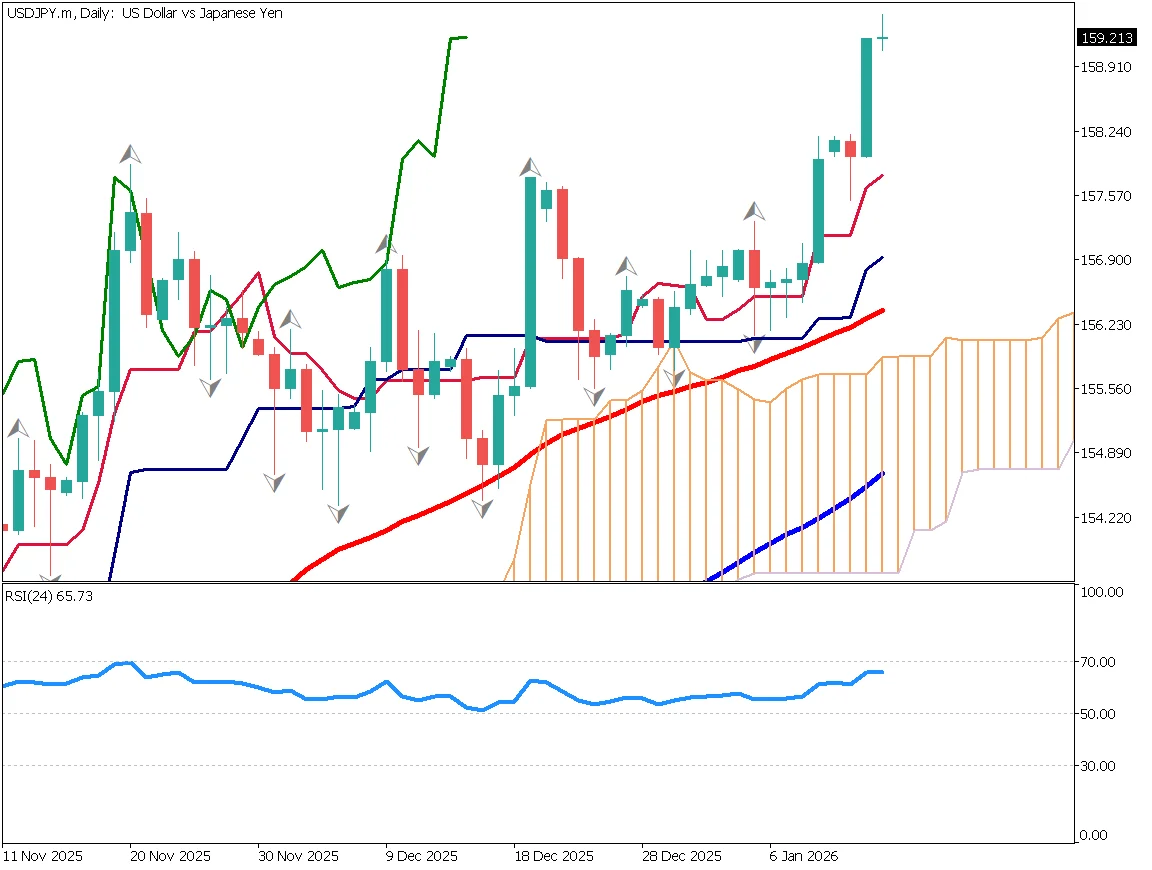
USD/JPY Approaches 160
Globally, the U.S. dollar has been weakening, but the Japanese yen is an exception among major currencies. As a result, USD/JPY is rising due to yen selling. The main driver is Prime Minister Takaichi's aggressive fiscal policy, which has raised concerns about a deterioration in Japan's public finances.
Following reports of an early dissolution of the House of Representatives, USD/JPY moved higher, breaking above the 158 resistance level and advancing into the mid-159 range. This marks the highest level since January 2025, making a break above 160 increasingly realistic.
Moving averages are trending gently upward, and the Ichimoku conversion line is acting as support. At this stage, there is little sign of imminent currency intervention. Attention is focused on whether the pair can break above the July 2024 high of 161.95.
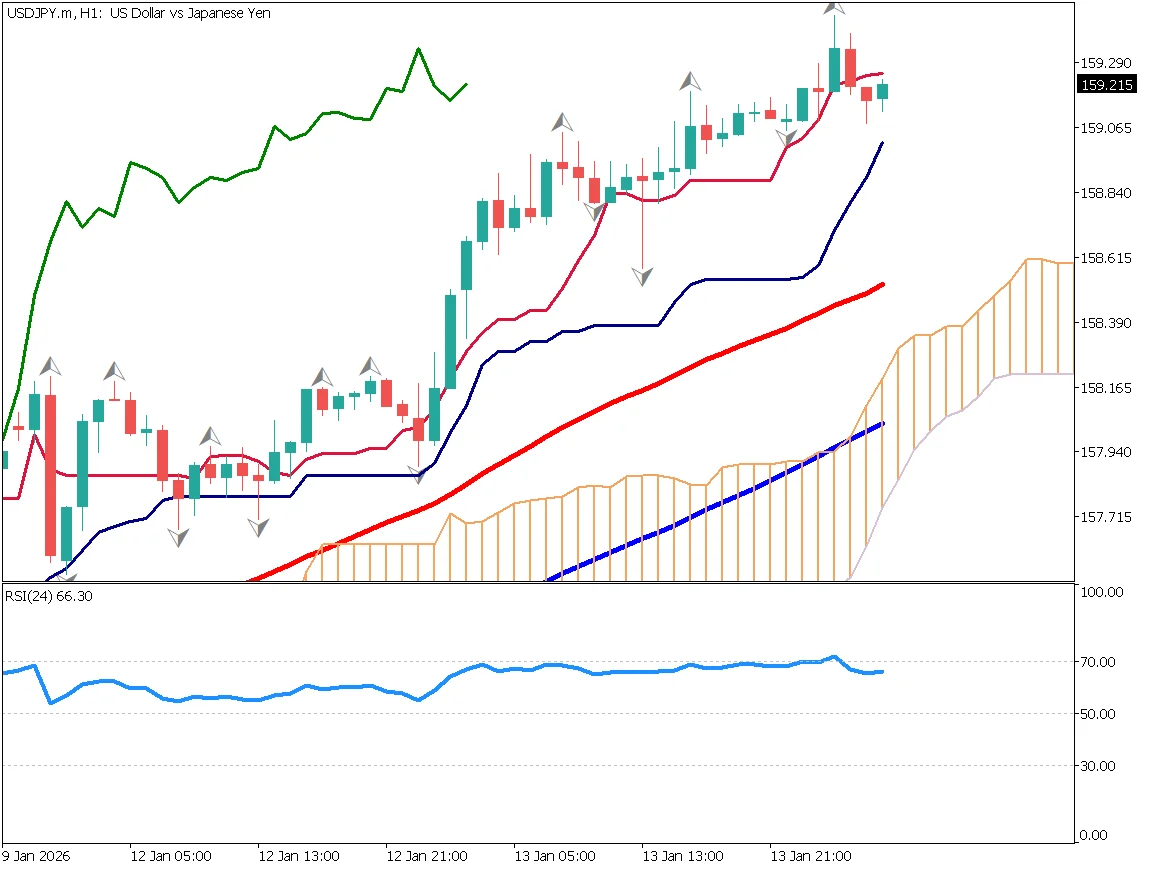
Upward Momentum Slightly Weakening
After a sharp rise from 157, USD/JPY reached the upper 159 area. However, upward momentum has eased somewhat, and the price has slipped below the conversion line. Over the long term, upward pressure remains, but a corrective move, such as a retracement to the midpoint, may occur.
The area around the upper 158 level, where the 52-day moving average is located, may act as support. The Nikkei average has also surged but appears to be losing momentum. Buying on dips remains the preferred strategy.
Key Economic Indicators and Events Today
| Economic Indicator | Time |
|---|---|
| U.S. Retail Sales | 22:30 |
| U.S. Existing Home Sales | 24:00 |
Ready to trade?
Open live accountRelated Analysis
![[Special Edition] When Will the Bank of Japan's Next Rate Hike Come?](/_next/image/?url=%2Fimages%2Fmarket-analysis%2F20251031USDJPYDAY.webp&w=3840&q=75&dpl=dpl_77ssCXjCb12GKyGPb1A64J67PTHc)
[Special Edition] When Will the Bank of Japan's Next Rate Hike Come?
The Bank of Japan decided to keep its policy rate unchanged at around 0.5%. Governor Kazuo Ueda stated that the BOJ would closely watch wage negotiations in next spring's "Shuntō" before making any policy changes.
USD/JPY Faces Resistance as BOJ Keeps Policy Unchanged
The Bank of Japan decided to maintain its current policy settings. Markets are focusing on whether the Governor will mention a possible rate hike in his press conference. Meanwhile, although the U.S. has already begun rate cuts, opinions differ on a possible additional cut in December.
USD/JPY Forms Double Top, Downtrend Ahead?
USD/JPY is forming a double top pattern, trading in the low 151 range. Goldman Sachs forecasts a potential return to around 100 if interest rates continue rising over the next decade. The FOMC meeting is scheduled for early tomorrow with a rate cut already priced in.
This material is for informational purposes only and does not constitute investment advice. Trading leveraged products involves significant risk of loss. Past performance is not indicative of future results.