Will USD/JPY Continue Rising? Don’t Miss the Breakout

Daily Market Analysis
Expert analysis of today's market movements and trading opportunities
Daily Market Analysis
Expert analysis of today's market movements and trading opportunities
Fundamental Analysis
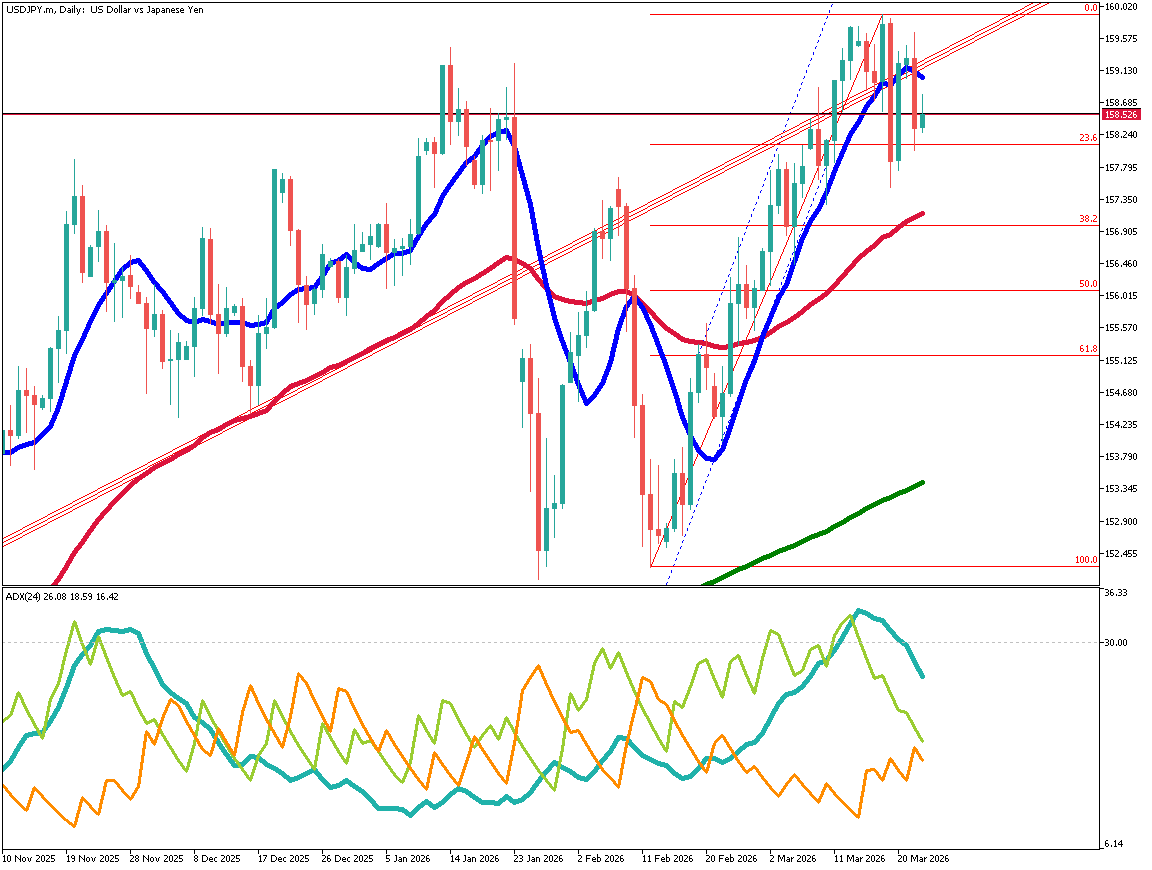
- Amid escalating U.S.–Iran tensions and rising oil price pressure, USD/JPY rebounded from the 200-day EMA. On the daily chart, the pair remains within an ascending channel and may target the 157 neckline. On the hourly chart, an ascending triangle has formed with resistance around 155.40. A breakout could accelerate gains, while a move below the baseline may trigger a correction.
Fundamental Analysis
As the United States prepares for potential military action against Iran, tensions between the two countries are intensifying. With both sides moving toward a wartime stance, upward pressure on crude oil prices is increasing, which may further strengthen yen depreciation.
Rebound at the 200-day EMA
It is clearly evident that the 200-day EMA is functioning as a support level. Although the baseline remains overhead, as explained in the video, the market continues to move within a large ascending parallel channel, suggesting sustained upward pressure.
If the price breaks above the baseline, it may aim for the 157 yen level, which serves as the neckline.
Should the Strait of Hormuz—an essential oil shipping route—be closed due to U.S.–Iran conflict, crude oil prices could surge. Rising resource prices typically exert downward pressure on the yen. With both nations currently on alert, global market caution is increasing.
A double bottom formation suggests the possibility of further gains toward the upper boundary of the ascending channel.
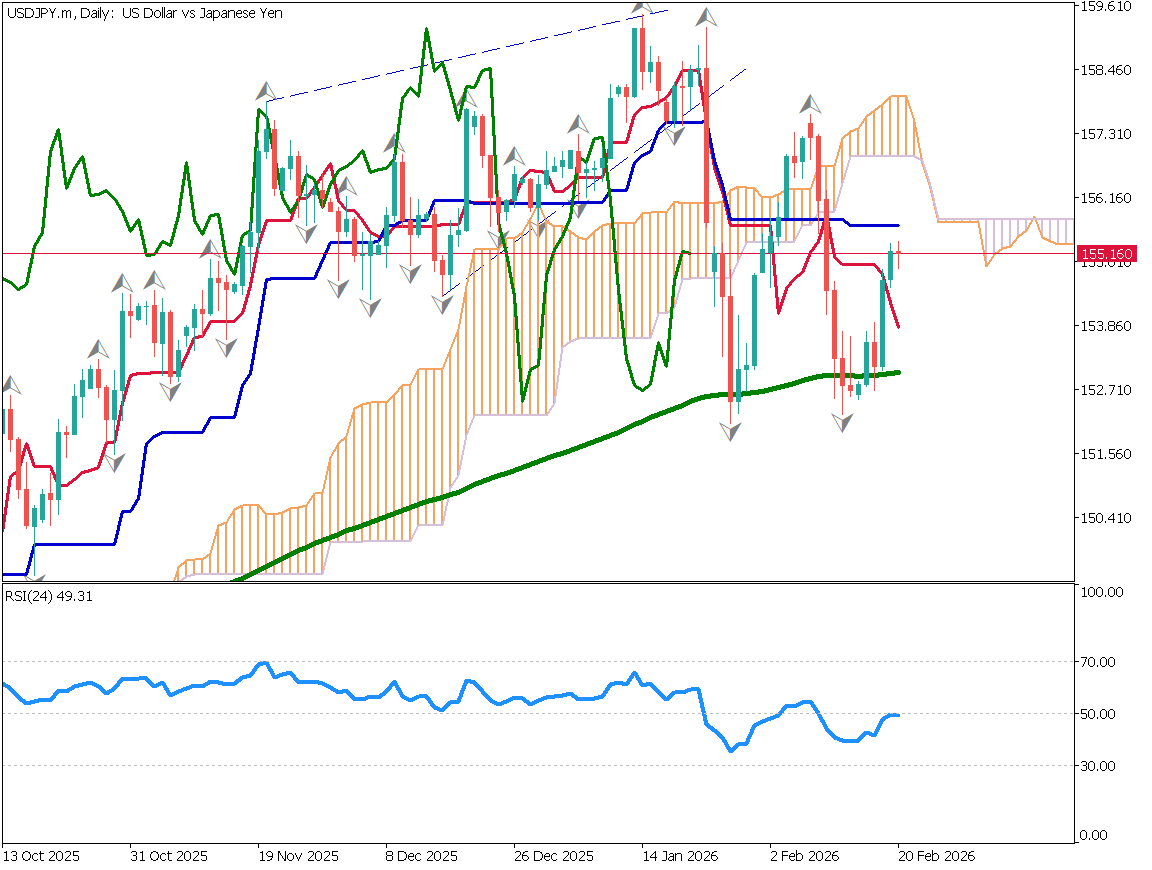
[USD/JPY – Daily Chart]
Resistance Around 155.50 Yen
On the hourly chart, a bullish ascending triangle pattern has formed. The 155.40 level is acting as resistance, and a breakout above this level could lead to a move toward 157 yen, the neckline level.
As long as price remains above the hourly baseline, a bullish trading bias is preferred.
However, if the baseline is broken, a sharp decline could follow. In that case, traders may consider stopping out and looking for another buying opportunity near the 200-day EMA.
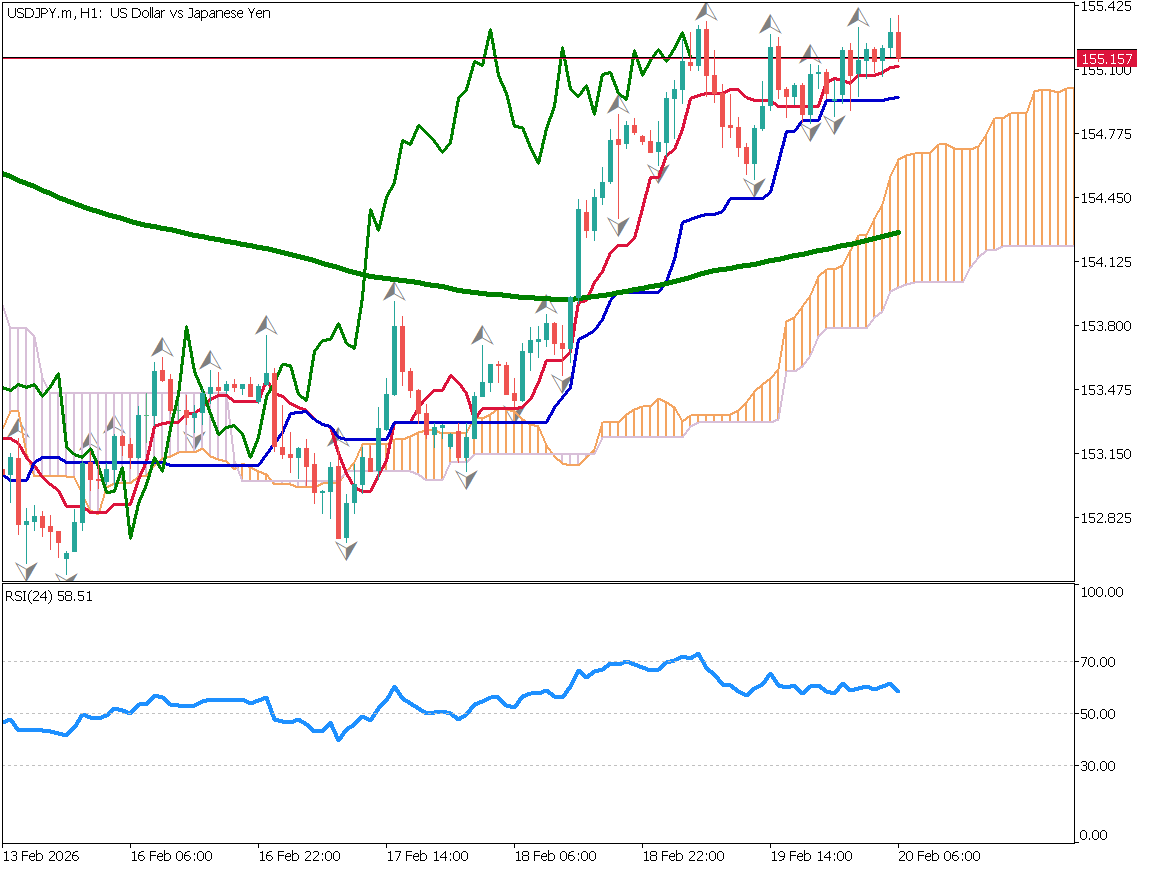
[USD/JPY – 1-Hour Chart]
Today’s Economic Indicators
22:30 (JST) – U.S. Personal Consumption Expenditures (December PCE)
22:30 (JST) – U.S. Real GDP (Q4)
24:00 (JST) – U.S. Michigan Consumer Sentiment Index (February)
Ready to trade?
Open live accountRelated Analysis
This material is for informational purposes only and does not constitute investment advice. Trading leveraged products involves significant risk of loss. Past performance is not indicative of future results.