EUR/USD at a Turning Point – New York Session

Daily Market Analysis
Expert analysis of today's market movements and trading opportunities
Daily Market Analysis
Expert analysis of today's market movements and trading opportunities
Fundamental Analysis
Can It Hold Above 1.15?
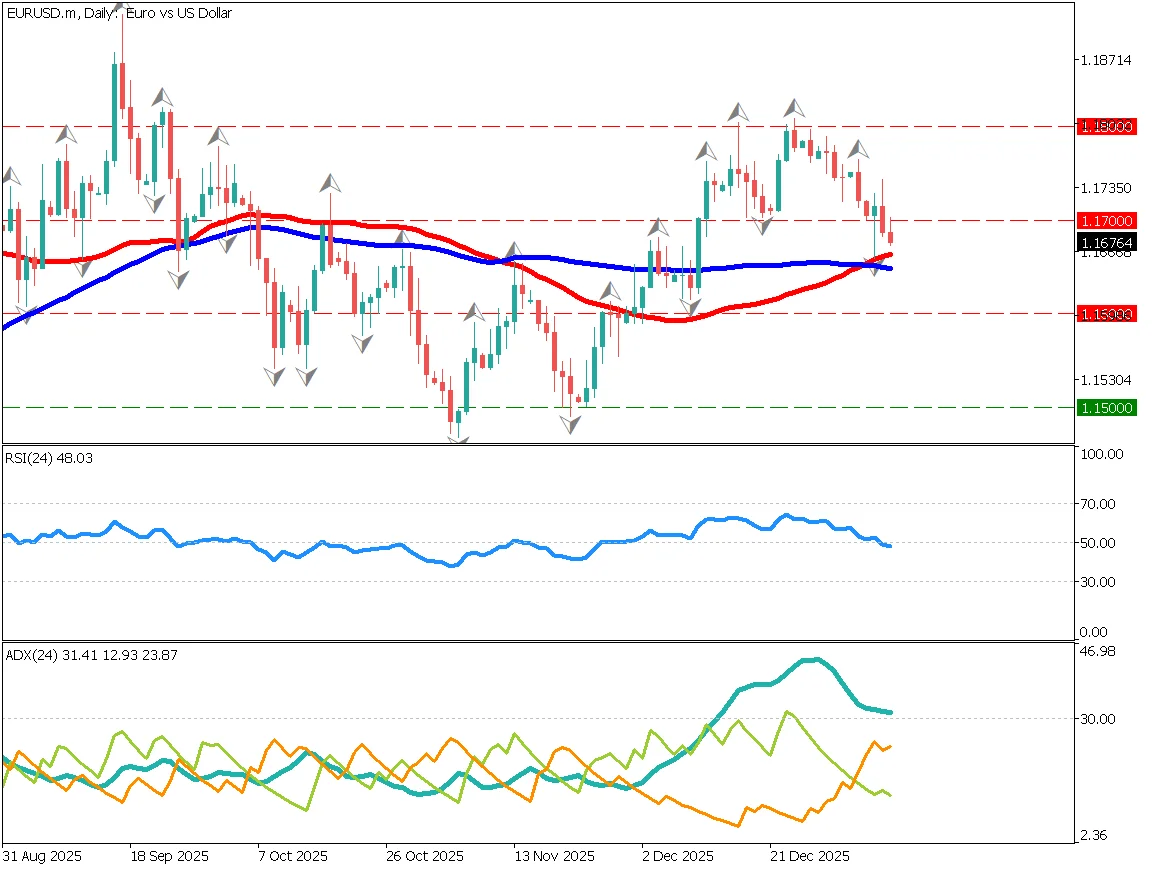
EUR/USD has been moving within a range between 1.15 and 1.18. Although it briefly broke above 1.18, strong selling pressure pushed it back inside the range. A bearish candlestick appeared after the recent high, showing that sellers are gaining control. The pair is now fluctuating slightly around 1.15.
The RSI shows that the 50 level acts as resistance, meaning that selling pressure increases whenever prices attempt to rise. This suggests that upside momentum is weak.
The key focus is whether 1.15 will shift from support to resistance.

Day Trading Strategy for EUR/USD
Currently, the moving averages are converging, but a golden cross has not yet formed, making it too early to confirm a trend reversal. Selling pressure may strengthen, and traders should wait for clearer direction.
However, 1.15 remains a strong support zone. A decisive break below it could trigger stop-loss orders and accelerate the downward move.
A suggested strategy is to sell around 1.16, take profit near 1.15, and place a stop loss at 1.1630.

Key Economic Events Today
Note: U.S. economic releases may be delayed due to the government shutdown.
| Indicator | Time (JST) |
|---|---|
| Bank of England Policy Rate Decision | 21:00 |
| U.S. Jobless Claims | 22:30 |
Ready to trade?
Open live accountRelated Analysis
EUR/USD in a Range Market, Focus on US–EU Tensions
Daily Market Report [January 8, 2026]
EUR/USD Rises Gradually as the Rate-Cut Cycle Ends
ECB board member Schnabel stated that "there is no disagreement that the next move could be a rate hike." Following this comment, EUR/USD briefly surged above 1.167.
Crude Oil Surges Amid Iran Conflict: Yen Under Pressure, The Path to 160
This material is for informational purposes only and does not constitute investment advice. Trading leveraged products involves significant risk of loss. Past performance is not indicative of future results.