EUR/USD in a Range as a Second Geopolitical Risk Emerges

Daily Market Analysis
Expert analysis of today's market movements and trading opportunities
Daily Market Analysis
Expert analysis of today's market movements and trading opportunities
Fundamental Analysis
- Europe is pushing back against U.S. claims over Greenland
- Following Ukraine, this issue has emerged as a second geopolitical risk, leading to renewed euro weakness
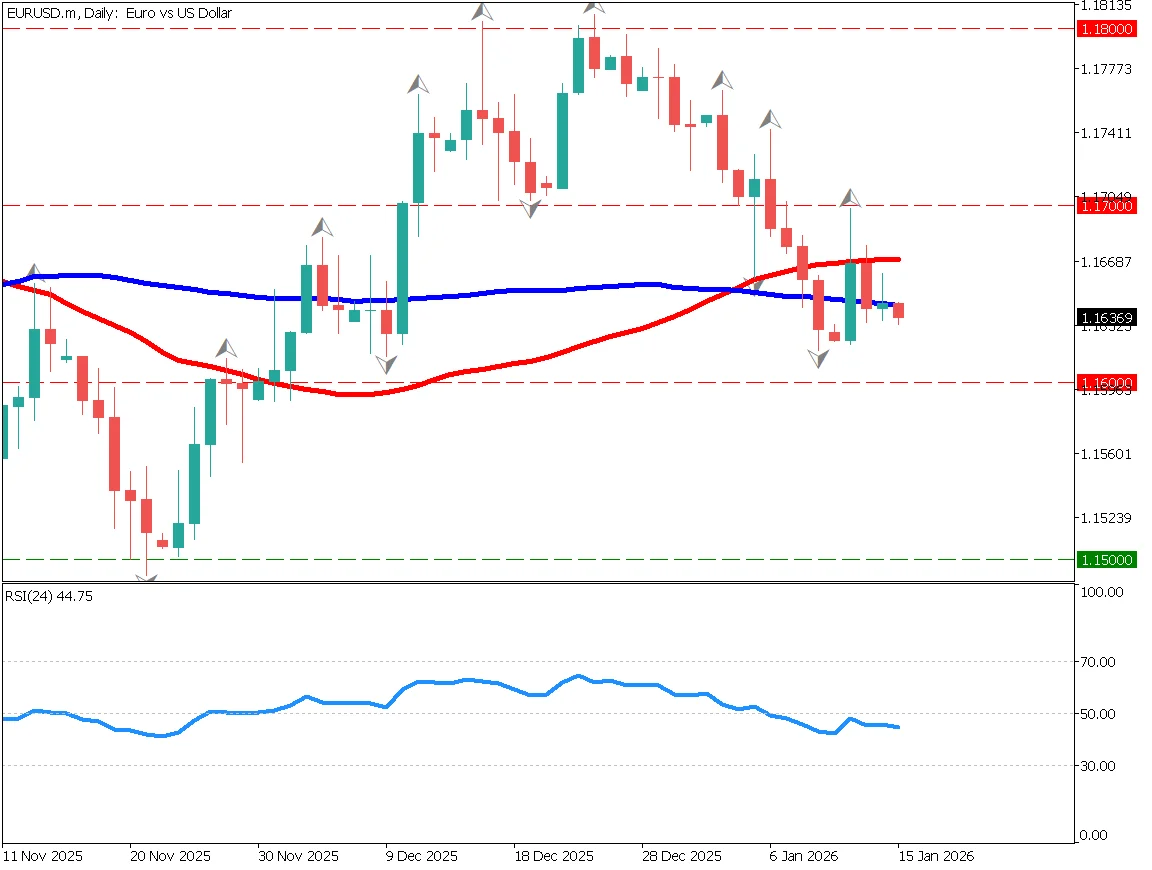
Range-Bound EUR/USD
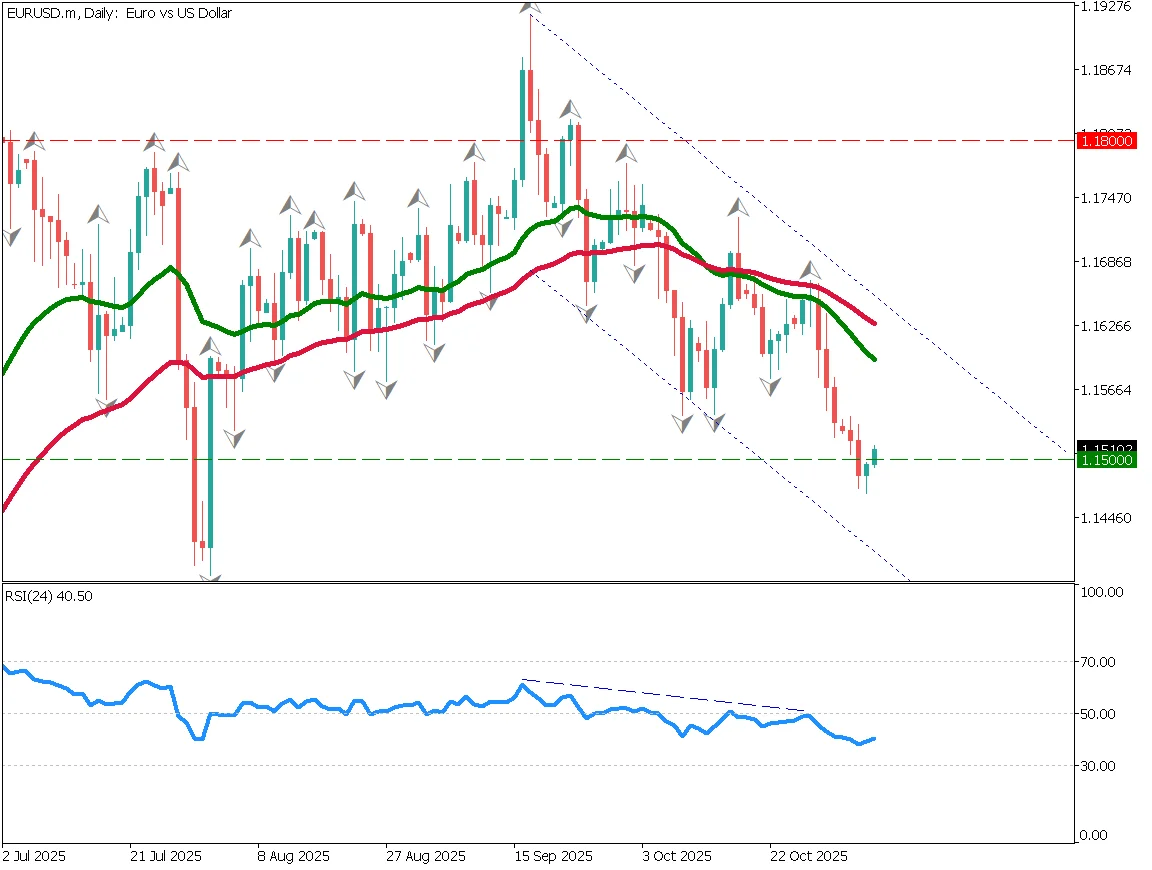
EUR/USD is trading in a range. Round numbers are acting as key support and resistance levels. The pair is moving between 1.15 and 1.18, and it is currently falling from the 1.18 level. Price has dropped below the 90-day moving average, and if it breaks below 1.16, a move toward 1.15 is likely.
RSI remains below 50, showing increasing downside pressure. A bearish view remains valid until RSI approaches 30. Market focus is on whether price reacts at the 1.16 support level or breaks lower.
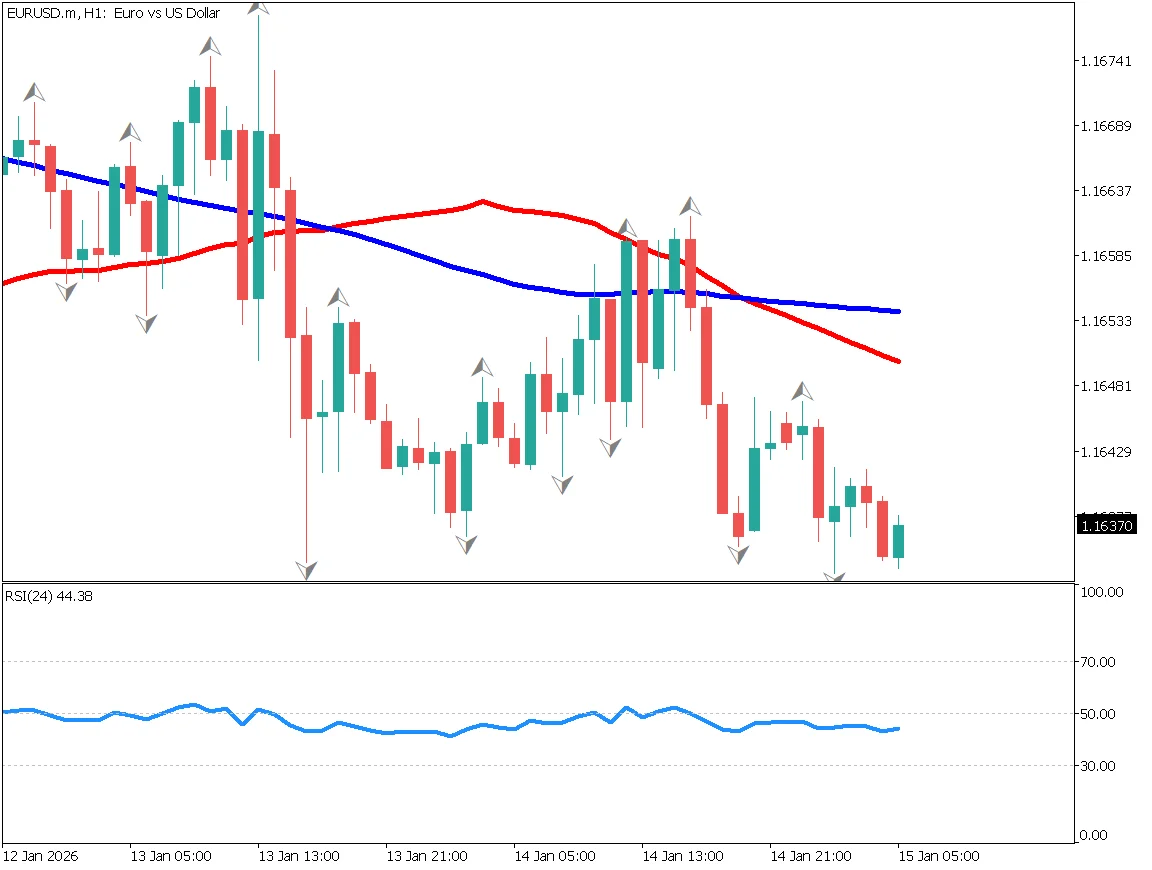
Short-Term Trend on the 1-Hour Chart
On the 1-hour chart, the short-term trend is bearish. The 52-period moving average is acting as resistance. While the downside momentum is not strong and price is consolidating, the overall picture suggests that 1.16 remains a key level.
For day trading, a sell-on-rallies approach is preferred. Staying on the sidelines is reasonable until 1.16 breaks. If price moves below 1.16, new short positions targeting 1.15 could be considered.
Key Economic Indicators Today
| Economic Indicator | Time |
|---|---|
| U.S. Empire State Manufacturing Index (January) | 22:30 |
| U.S. Initial Jobless Claims | 22:30 |
Ready to trade?
Open live accountRelated Analysis
EUR/USD in a Range Market, Focus on US–EU Tensions
Daily Market Report [January 8, 2026]
EUR/USD Rises Gradually as the Rate-Cut Cycle Ends
ECB board member Schnabel stated that "there is no disagreement that the next move could be a rate hike." Following this comment, EUR/USD briefly surged above 1.167.
EUR/USD at a Turning Point – New York Session
EUR/USD forms a short-term downward channel as the ECB may end its rate-cut cycle. The pair struggles to hold above 1.15, with RSI resistance at 50 indicating weak upside momentum.
This material is for informational purposes only and does not constitute investment advice. Trading leveraged products involves significant risk of loss. Past performance is not indicative of future results.