2025: A Breakout Year for Gold

Daily Market Analysis
Expert analysis of today's market movements and trading opportunities
Daily Market Analysis
Expert analysis of today's market movements and trading opportunities
Fundamental Analysis
- Geopolitical risks have clearly increased
- U.S. rate cuts have supported gold prices
- Silver and platinum also surged, driven by follow-up buying
A Bearish Engulfing Pattern at High Levels
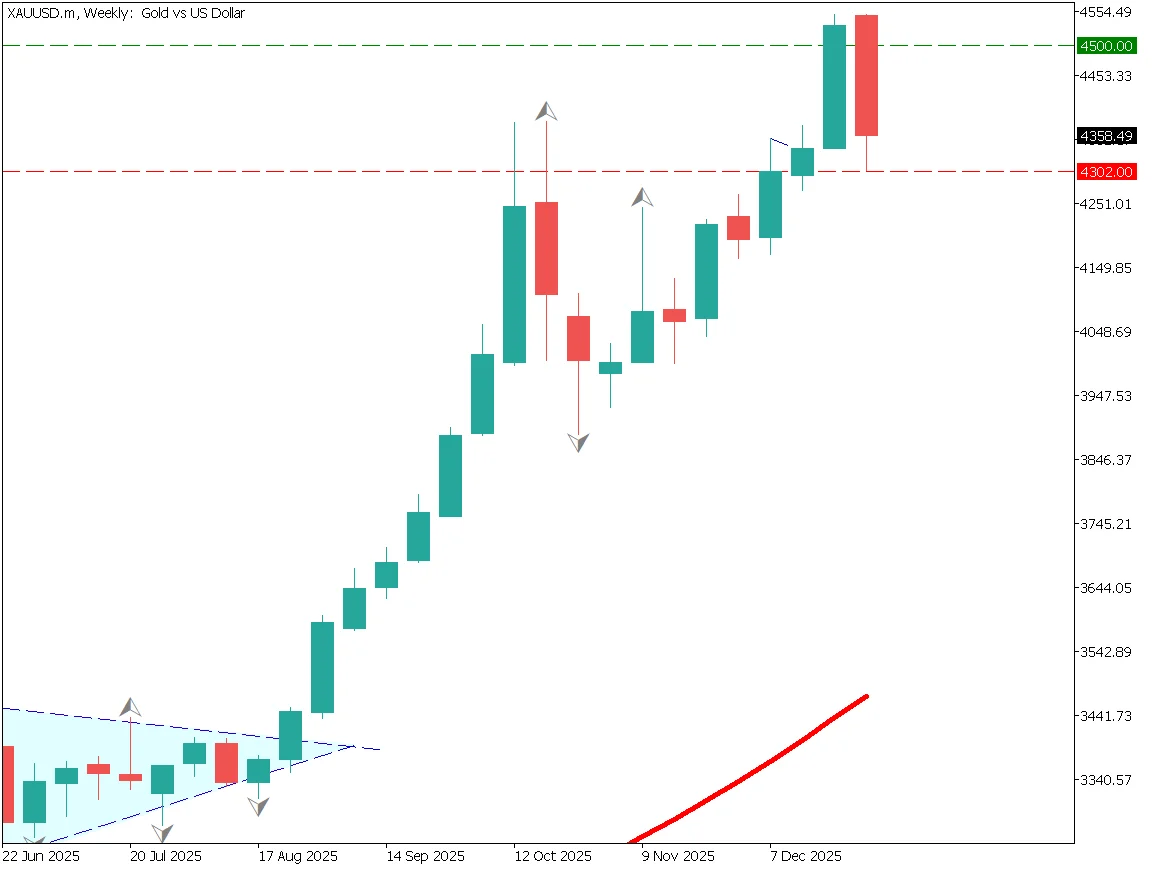
Let us look again at the weekly gold chart. In 2025, gold started around $2,596 and is trading near $4,300 at year-end, an increase of nearly $1,800 in one year. After touching the key $4,500 level, prices pulled back, but this move can be seen as a natural correction.
However, the RSI shows lower highs, indicating that selling pressure is gradually increasing. There are not many strong reasons to sell gold itself, but platinum and silver appear more speculative, and sharp declines remain possible.
In precious metals markets, it is important to distinguish between real demand and speculation.
The 52-week moving average shows a very large deviation, so traders should avoid excessive positions and keep leverage low to prepare for potential sharp corrections.
Gold Strategy for 2026
Attention should be paid to a possible correction phase. Although there are many bullish factors, such as rising geopolitical risks and central bank gold purchases, a correction will eventually come. The uptrend has lasted for more than three years, so from a cycle perspective, the market may be nearing such a phase.
As more traders share this view, selling pressure on gold is likely to increase.
Ready to trade?
Open live accountRelated Analysis
Gold Rises Further as U.S. Rate Cuts Accelerate
U.S. interest rate cuts continue to support gold prices. A rare "cup with handle" pattern has appeared on the gold chart, suggesting potential for further gains toward $4,400.
Can Gold Maintain the $4,000 Level?
Federal Reserve Governor Waller advocated for a rate cut in December, citing a weakening labor market. In Japan, despite the holiday, the yen continues to weaken gradually.
Gold Falls Below $4,000 as Risk-Off Sentiment Eases
Gold briefly fell below $4,000 as risk-off sentiment eased after the U.S.–China trade agreement. The metal is correcting after a sharp rally, with potential support near $3,955 and $3,880.
This material is for informational purposes only and does not constitute investment advice. Trading leveraged products involves significant risk of loss. Past performance is not indicative of future results.