Gold Enters a Correction Phase, Pulls Back at $4,500

Daily Market Analysis
Expert analysis of today's market movements and trading opportunities
Daily Market Analysis
Expert analysis of today's market movements and trading opportunities
Fundamental Analysis
- European countries have reacted strongly to U.S. remarks regarding Greenland
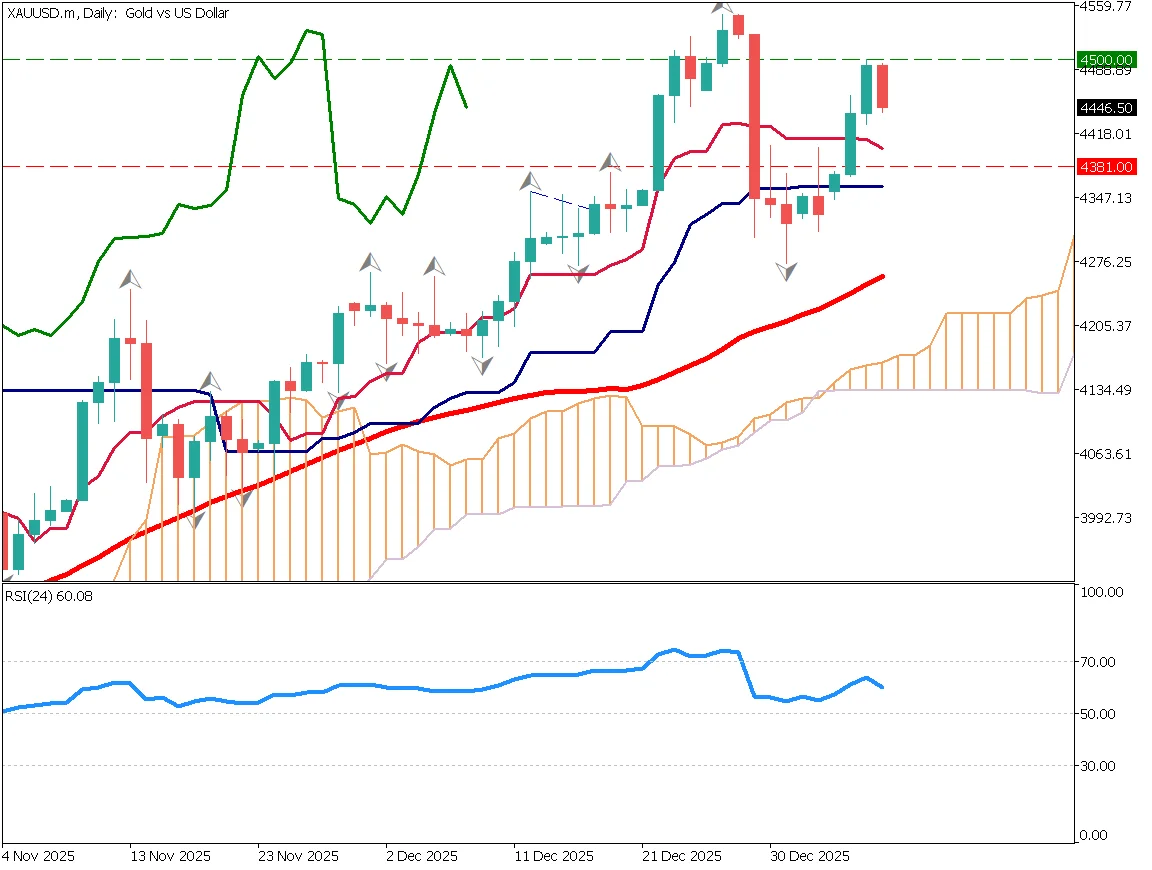
- The $4,500 level has functioned as a key resistance, causing gold prices to pull back
- While the broader market remains in a risk-on mood, multiple risk factors continue to exist
Pullback at a Key Psychological Level
Gold has reversed at the $4,500 level, which is acting as a strong psychological resistance. Precious metals, including gold, have recovered sharply from the year-end decline, but the current price action suggests a pause in the rally. With the U.S. employment report scheduled for the end of the week, the market is less likely to make aggressive moves, and the current trend can be seen as position adjustment.
Regarding U.S. remarks on Greenland, many countries initially did not take them seriously. However, following the Trump administration's actions toward Venezuela, perceptions have changed. If the U.S. were to use military force to claim Greenland, it could potentially lead to conflict within NATO.
Such developments could impact not only gold but also the EUR/USD pair.
Although gold is currently in a correction phase, it may attempt another break above $4,500. From a fundamental perspective, there is no clear reason to sell gold.
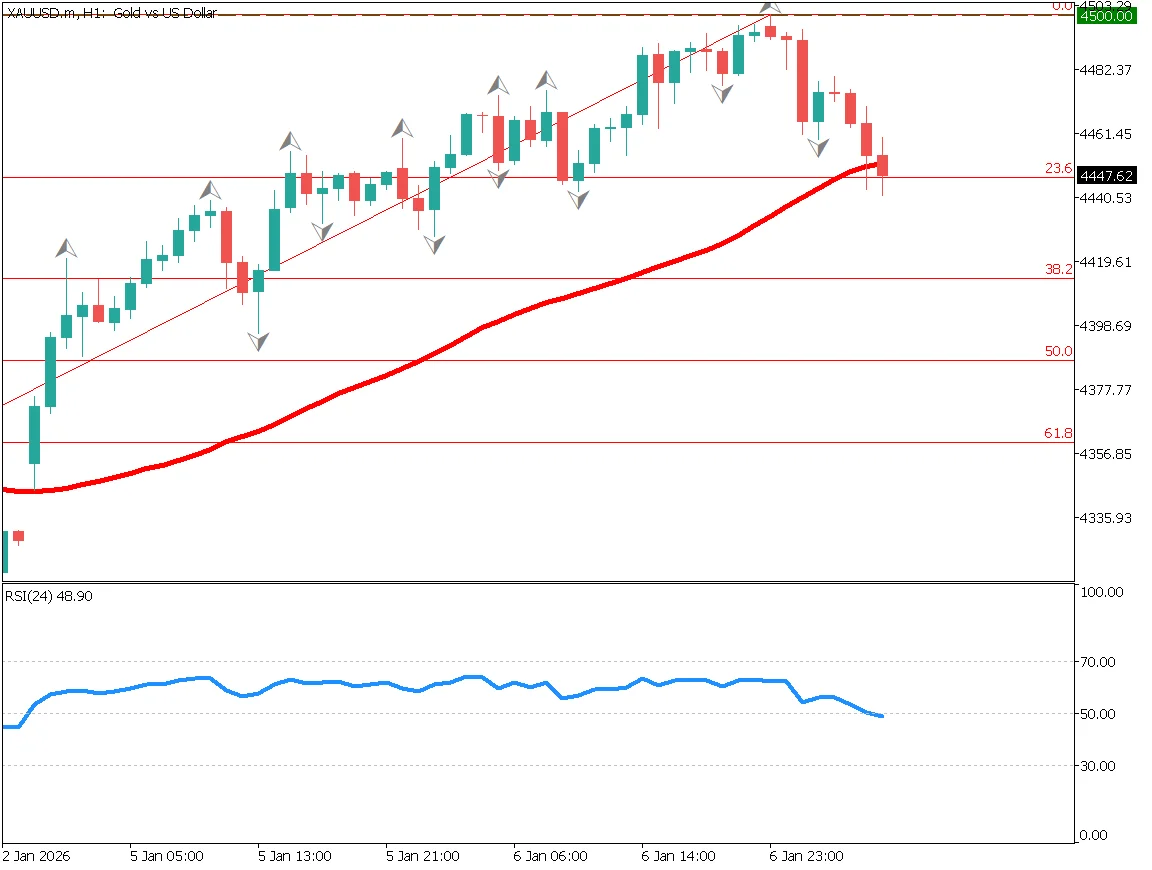
Corrective Decline on 1-Hour Chart
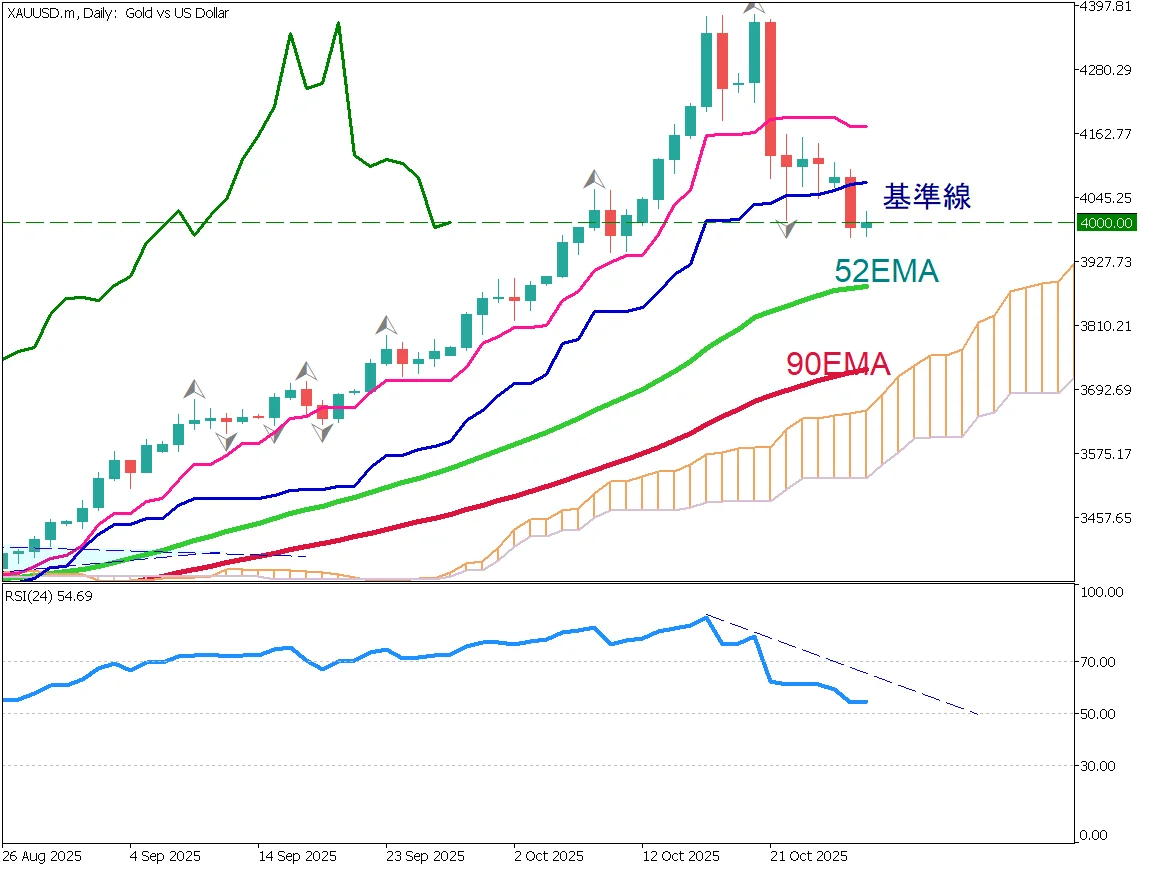
Fibonacci retracement analysis shows that the 23.6% level is acting as support. Prices are approaching the 52-period moving average. If gold breaks below the 23.6% level, the correction could deepen, with downside targets around $4,420 and $4,390.
The RSI has fallen below 50, indicating increasing downside pressure. There is a possibility that RSI could move toward the 30 level.
A pullback below $4,400 may provide an opportunity for buying on dips. From a long-term perspective, gold is expected to remain in an uptrend.
Key Economic Indicator Today
| Event | Time |
|---|---|
| U.S. ADP Employment Report | 22:15 |
Ready to trade?
Open live accountRelated Analysis
Gold Rises Further as U.S. Rate Cuts Accelerate
U.S. interest rate cuts continue to support gold prices. A rare "cup with handle" pattern has appeared on the gold chart, suggesting potential for further gains toward $4,400.
Can Gold Maintain the $4,000 Level?
Federal Reserve Governor Waller advocated for a rate cut in December, citing a weakening labor market. In Japan, despite the holiday, the yen continues to weaken gradually.
Gold Falls Below $4,000 as Risk-Off Sentiment Eases
Gold briefly fell below $4,000 as risk-off sentiment eased after the U.S.–China trade agreement. The metal is correcting after a sharp rally, with potential support near $3,955 and $3,880.
This material is for informational purposes only and does not constitute investment advice. Trading leveraged products involves significant risk of loss. Past performance is not indicative of future results.