Gold Hits a New All-Time High: How Far Can Prices Rise?

Daily Market Analysis
Expert analysis of today's market movements and trading opportunities
Daily Market Analysis
Expert analysis of today's market movements and trading opportunities
Fundamental Analysis
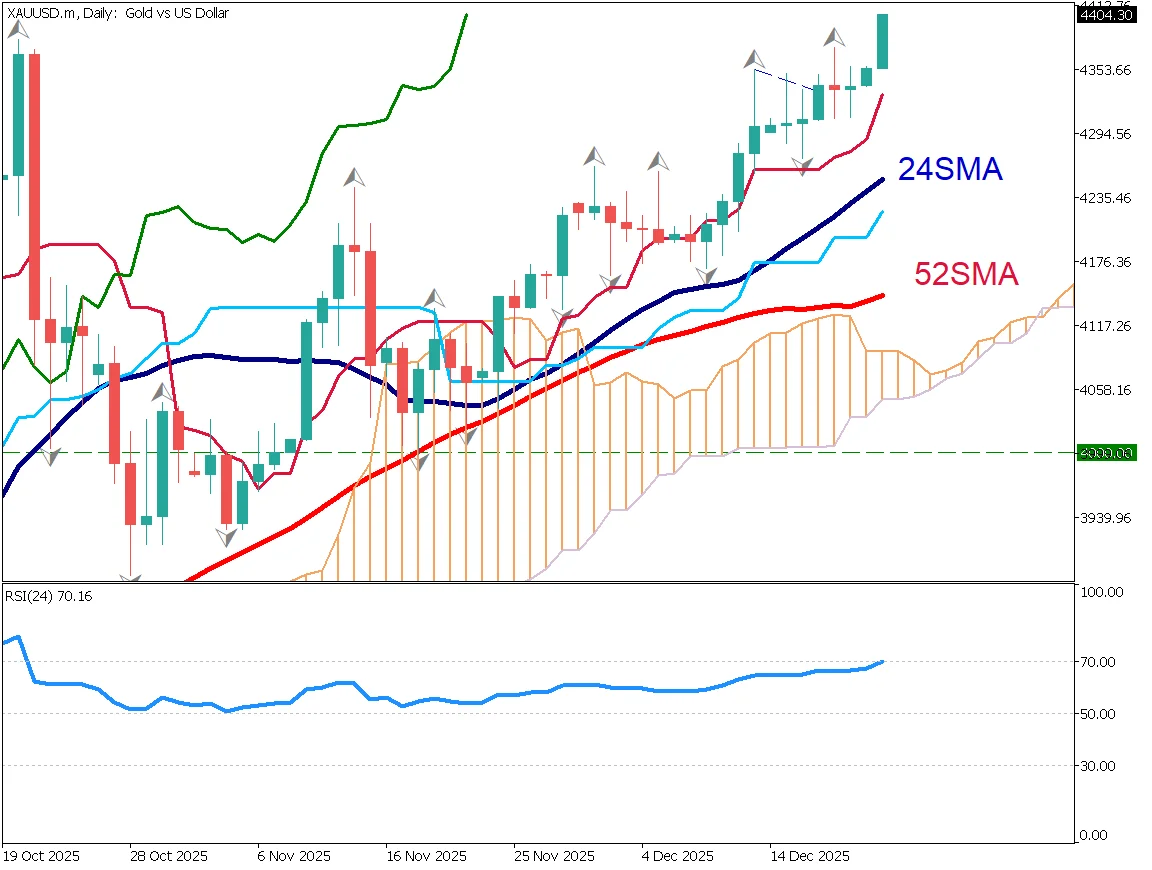
- Gold has broken through a key psychological level and reached the $4,400 range, marking a new all-time high
- Weekly RSI (24) stands around 75, suggesting strong momentum, possibly driven by capital shifting away from the U.S. dollar following expectations of interest rate cuts
Gold Records New All-Time High
Gold recorded its highest price since October 20, 2025. The conversion line is acting as a support level, and prices continue to rise. After last week's FOMC and Bank of Japan policy meetings, markets are now entering the Christmas holiday period. With thinner liquidity, volatility has increased.
According to Dow Theory, a new high confirms the continuation of an uptrend. Going forward, it will be important to monitor whether the conversion line continues to hold as support. Overall, the outlook remains bullish. Dollar selling pressure is strong, and funds may be flowing rapidly from the U.S. dollar into safe-haven assets such as gold.
RSI is near 70, a level where caution is often required. However, capital is flowing not only into gold but also into platinum and silver. The shift from currencies to precious metals is becoming clearer, and this trend is likely to continue.
It is important to watch whether this movement leads to selling pressure in U.S. equities. Extra caution is advised when trading during the year-end and New Year period.
Day Trading Strategy
After the appearance of a strong bullish candle, gold continued to rise and updated its high. Although the market is entering the Christmas holiday period with lower liquidity, volatility remains high. Following the break above $4,400, a temporary pause or pullback is possible.
With RSI around 71, caution is warranted. Waiting for pullback opportunities before entering long positions is preferable.

Today's Key Economic Indicator
| Event | Time |
|---|---|
| UK GDP | 16:00 |
Ready to trade?
Open live accountRelated Analysis
Gold Rises Further as U.S. Rate Cuts Accelerate
U.S. interest rate cuts continue to support gold prices. A rare "cup with handle" pattern has appeared on the gold chart, suggesting potential for further gains toward $4,400.
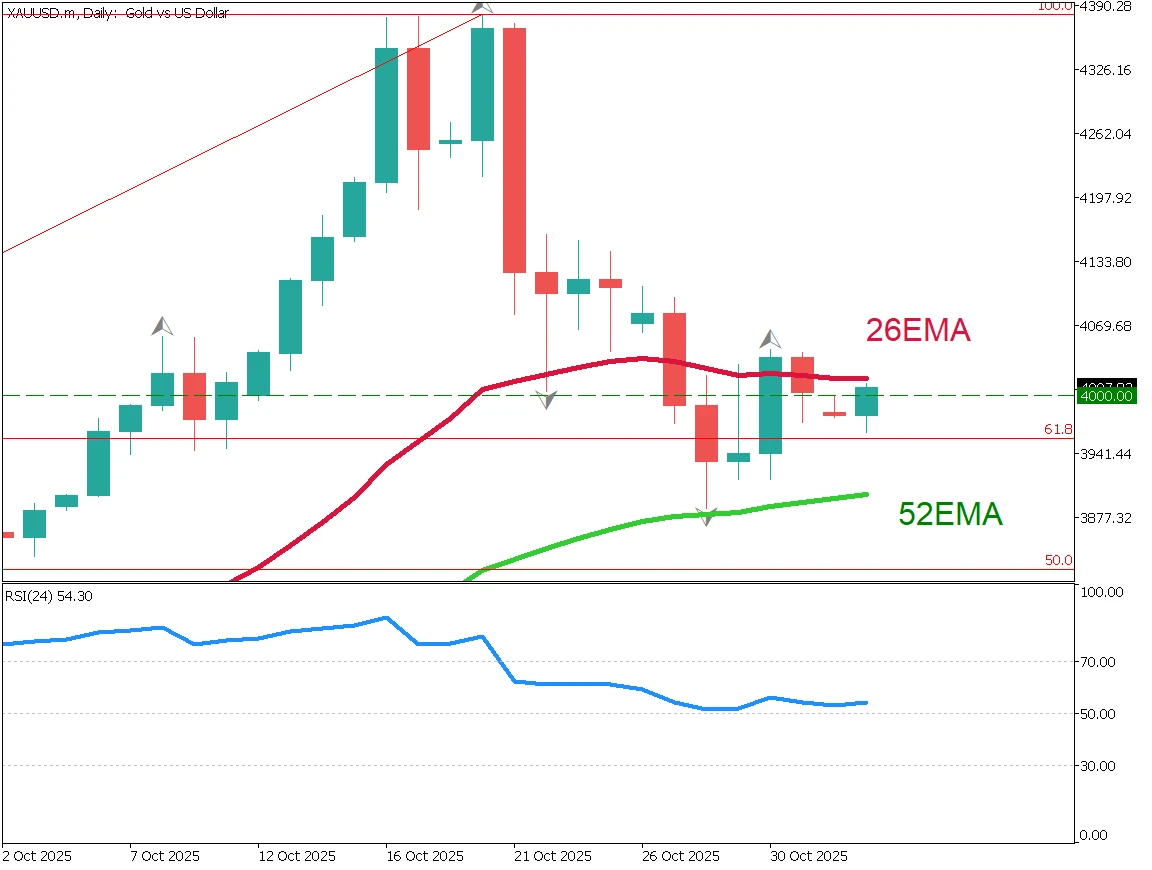
Can Gold Maintain the $4,000 Level?
Federal Reserve Governor Waller advocated for a rate cut in December, citing a weakening labor market. In Japan, despite the holiday, the yen continues to weaken gradually.
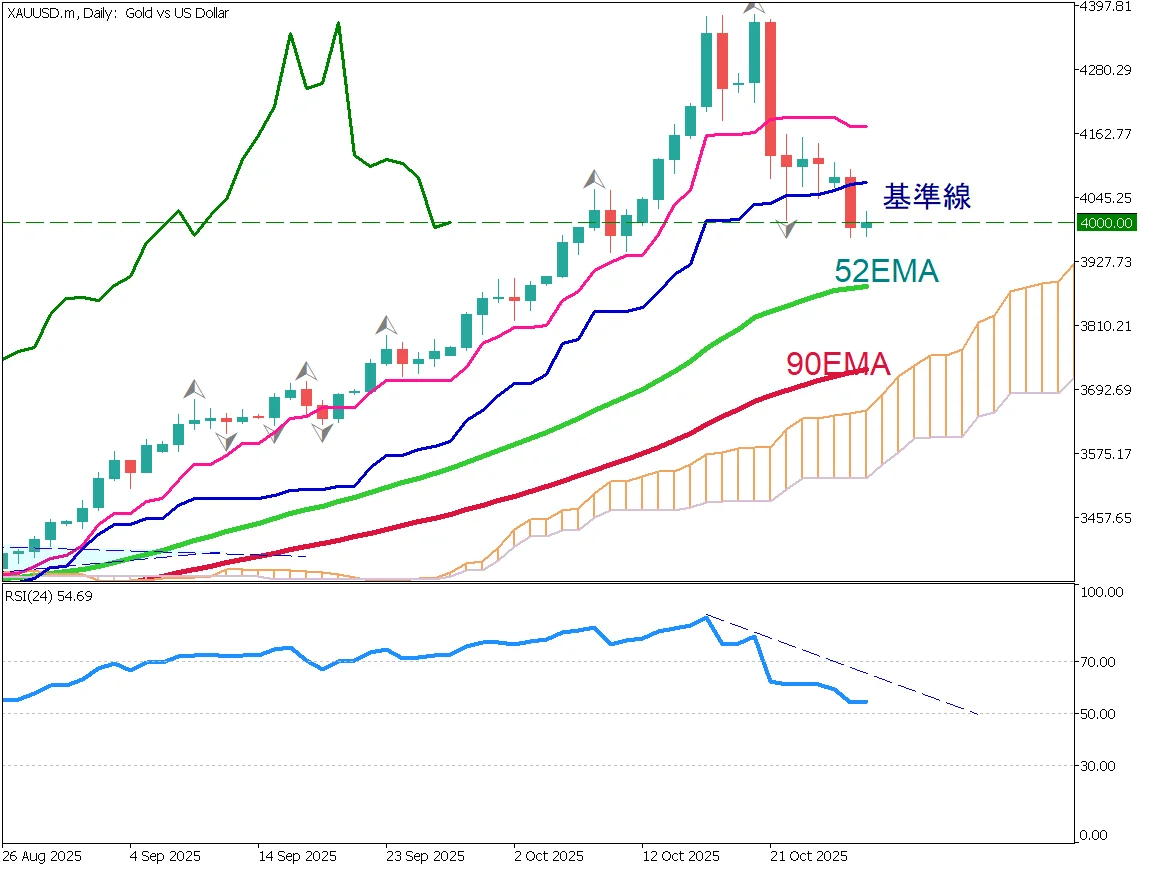
Gold Falls Below $4,000 as Risk-Off Sentiment Eases
Gold briefly fell below $4,000 as risk-off sentiment eased after the U.S.–China trade agreement. The metal is correcting after a sharp rally, with potential support near $3,955 and $3,880.
This material is for informational purposes only and does not constitute investment advice. Trading leveraged products involves significant risk of loss. Past performance is not indicative of future results.