Gold Rises Further as U.S. Rate Cuts Accelerate

Daily Market Analysis
Expert analysis of today's market movements and trading opportunities
Daily Market Analysis
Expert analysis of today's market movements and trading opportunities
Fundamental Analysis
- U.S. interest rate cuts continue to support gold prices
- A rare "cup with handle" pattern has appeared on the gold chart
Cup with Handle
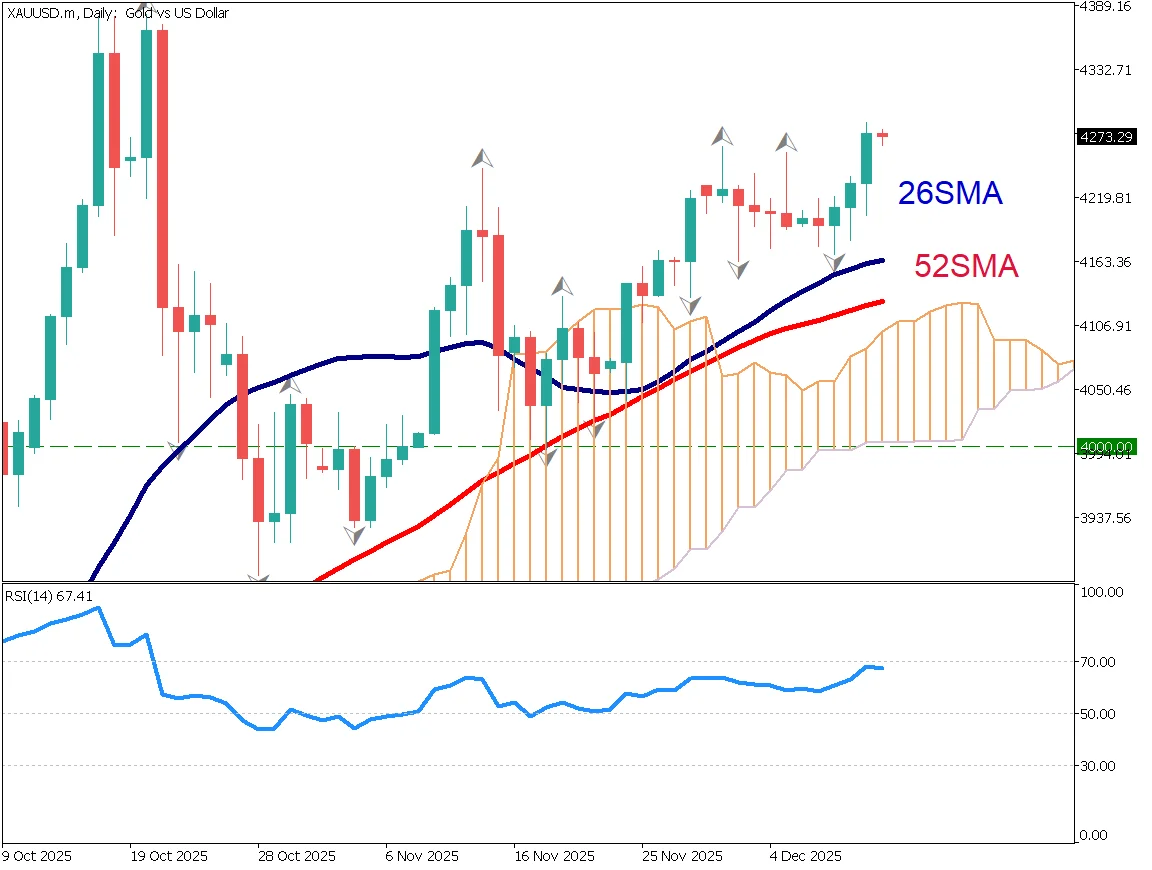
A rare "cup with handle" pattern has appeared on the gold chart. This pattern resembles a coffee cup, and when prices break above the "handle," it is considered a strong bullish signal.
Gold is currently trading around $4,268 and may move higher toward the $4,400 level. The 26-day moving average is functioning as a support line, while the 52-day moving average also provides support. In addition, the Ichimoku cloud lies below price, suggesting a very solid base.
From a fundamental perspective, the Federal Reserve has decided to cut interest rates, and expectations are growing that rate cuts will continue into 2026. Under such conditions, capital is likely to flow further into gold.
A new record high is expected.
Day Trading Strategy
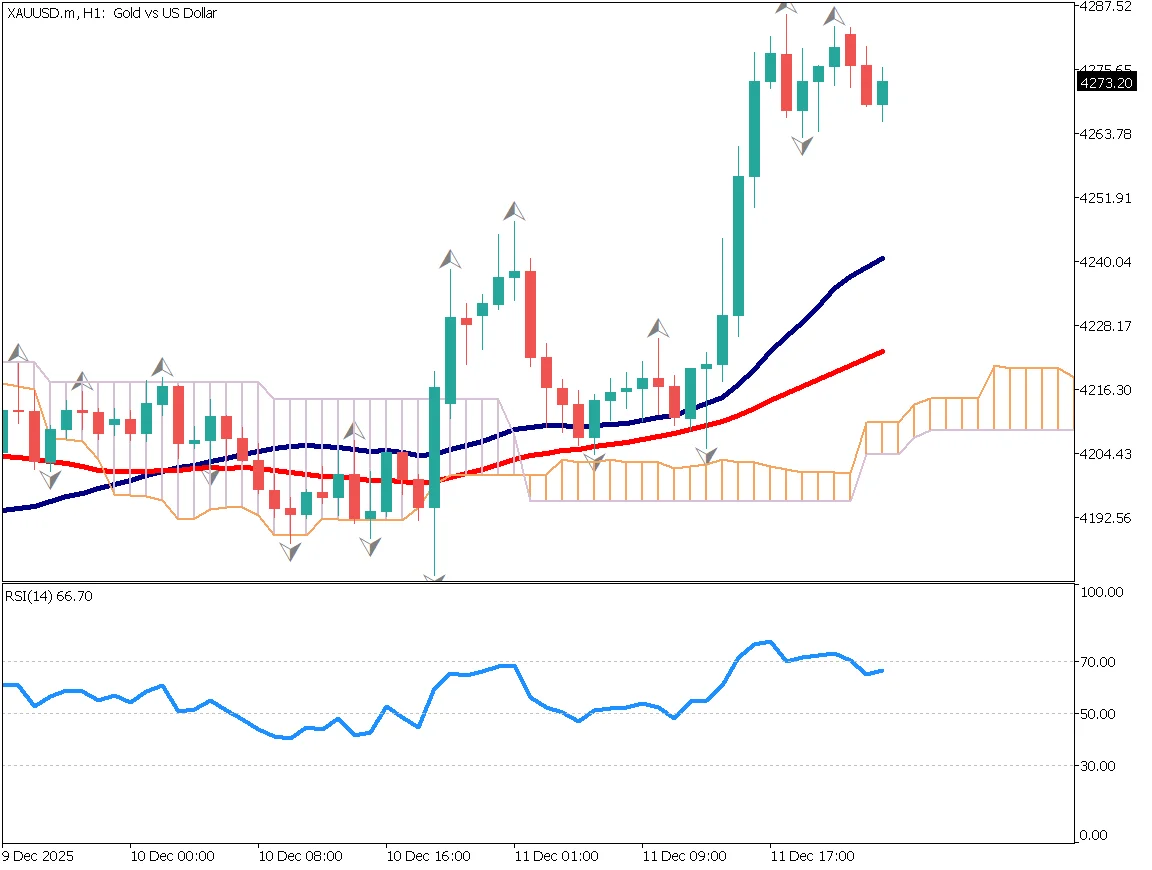
Gold has risen with some overheating, making short-term profit-taking more likely. It is advisable to wait patiently and look for buying opportunities on pullbacks. The 52-day moving average continues to act as strong support, which is also confirmed by the appearance of two fractals.
The RSI has moved below the 70 level, suggesting a possible decline toward the 50 level. The RSI 50 level often acts as support. If the uptrend continues, this level is likely to hold.
A pullback toward the $4,200 area would be an ideal buying zone. However, as today is Friday, caution is required when holding positions over the weekend.
Key Economic Indicator Today
| Indicator | Time |
|---|---|
| UK GDP | 16:00 |
Ready to trade?
Open live accountRelated Analysis
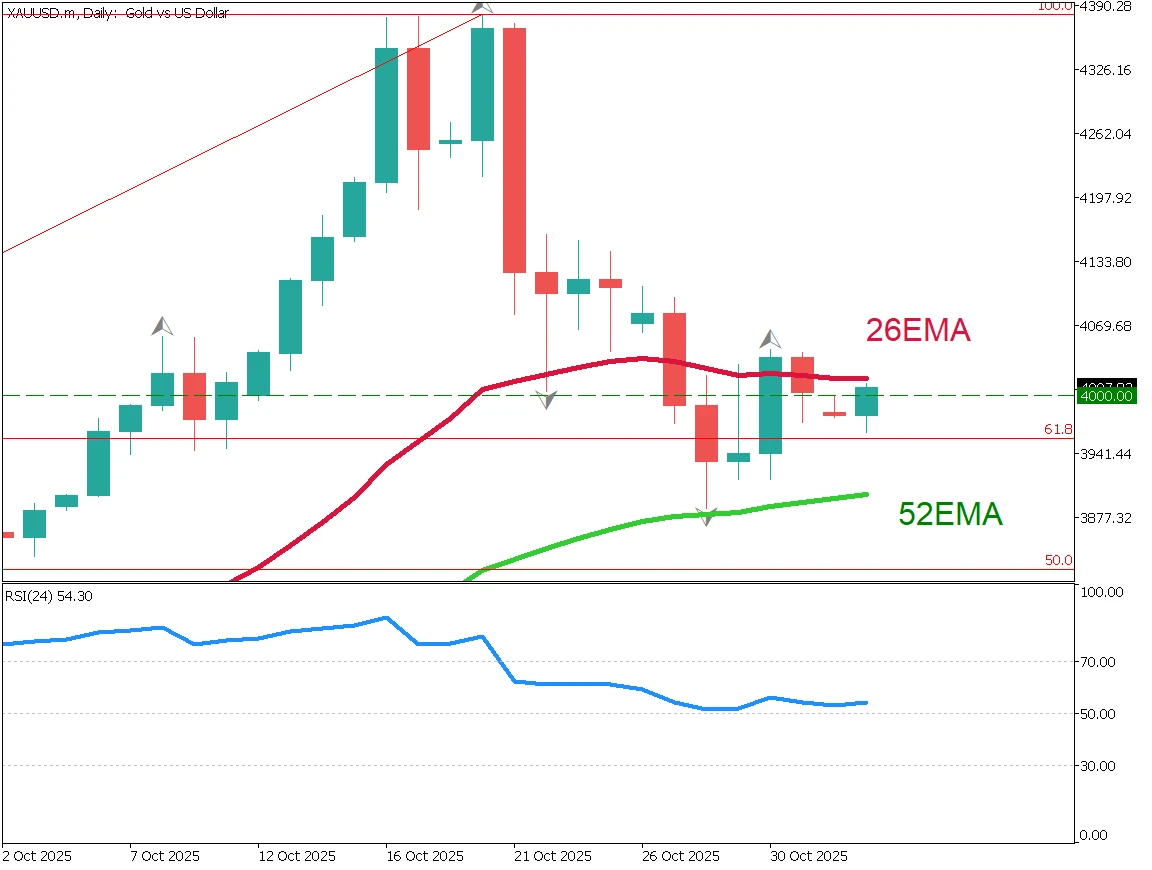
Can Gold Maintain the $4,000 Level?
Federal Reserve Governor Waller advocated for a rate cut in December, citing a weakening labor market. In Japan, despite the holiday, the yen continues to weaken gradually.
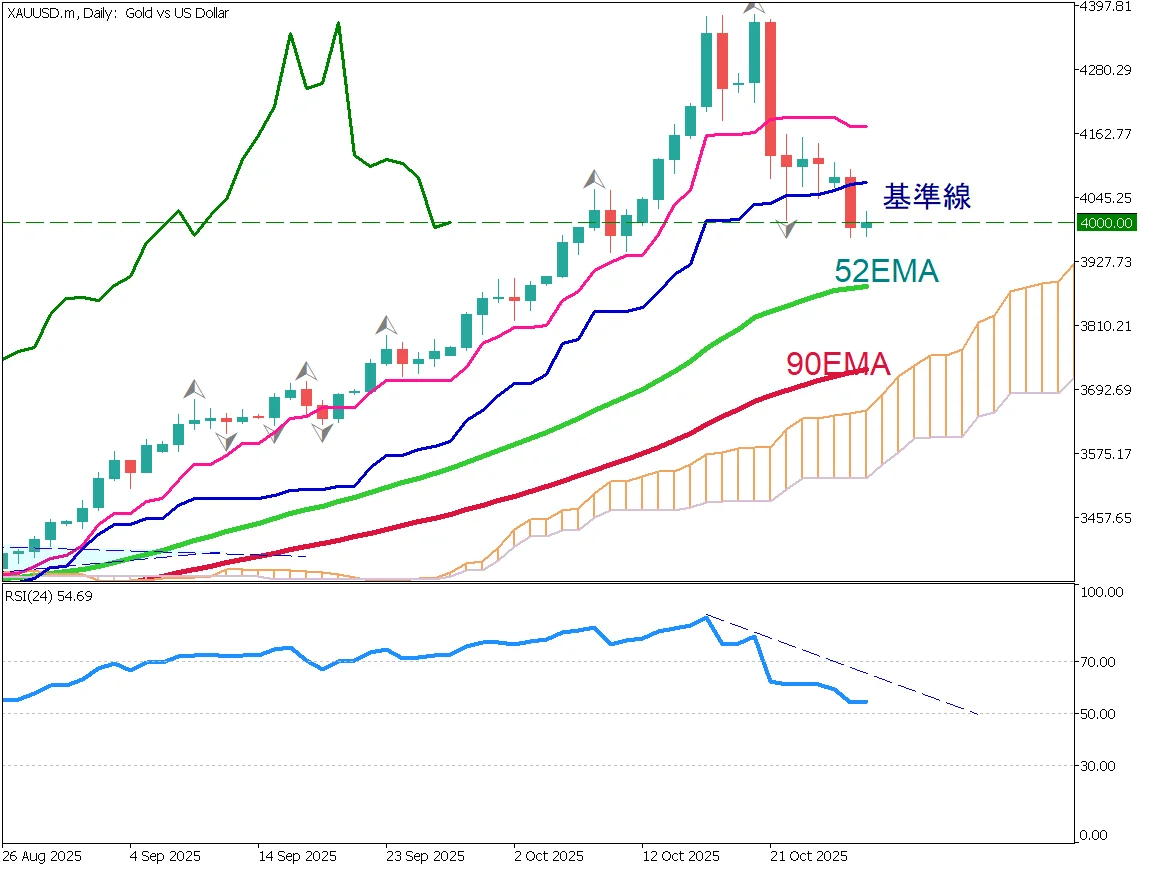
Gold Falls Below $4,000 as Risk-Off Sentiment Eases
Gold briefly fell below $4,000 as risk-off sentiment eased after the U.S.–China trade agreement. The metal is correcting after a sharp rally, with potential support near $3,955 and $3,880.
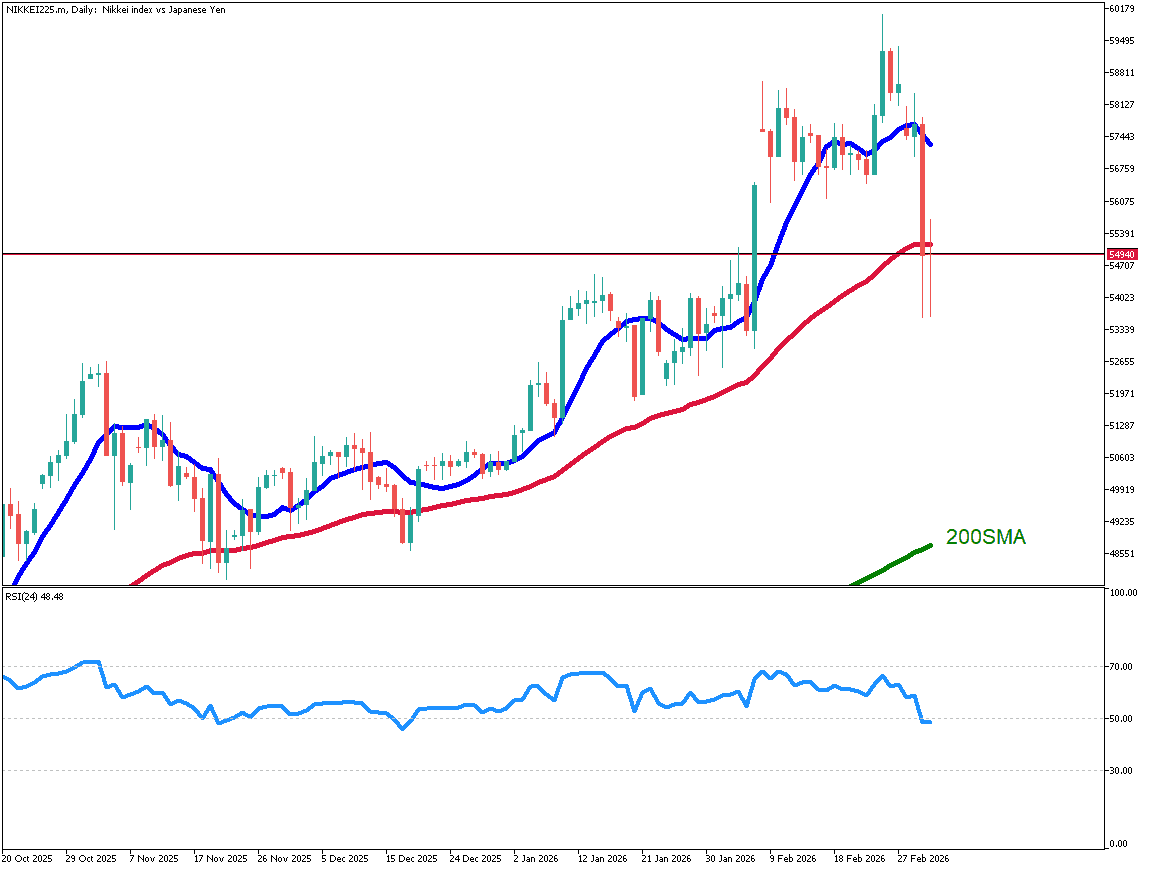
Nikkei Stock Average Plunges for Consecutive Days, Down 5,000 Yen
This material is for informational purposes only and does not constitute investment advice. Trading leveraged products involves significant risk of loss. Past performance is not indicative of future results.