Is a Ceiling Signal Forming for USD/JPY? The Fed Decides on a Rate Cut

Daily Market Analysis
Expert analysis of today's market movements and trading opportunities
Daily Market Analysis
Expert analysis of today's market movements and trading opportunities
Fundamental Analysis
- The U.S. Federal Reserve decided to cut rates, with three dissenting votes
- The dollar index fell, and selling pressure increased on USD/JPY as well
Will USD/JPY Reverse?
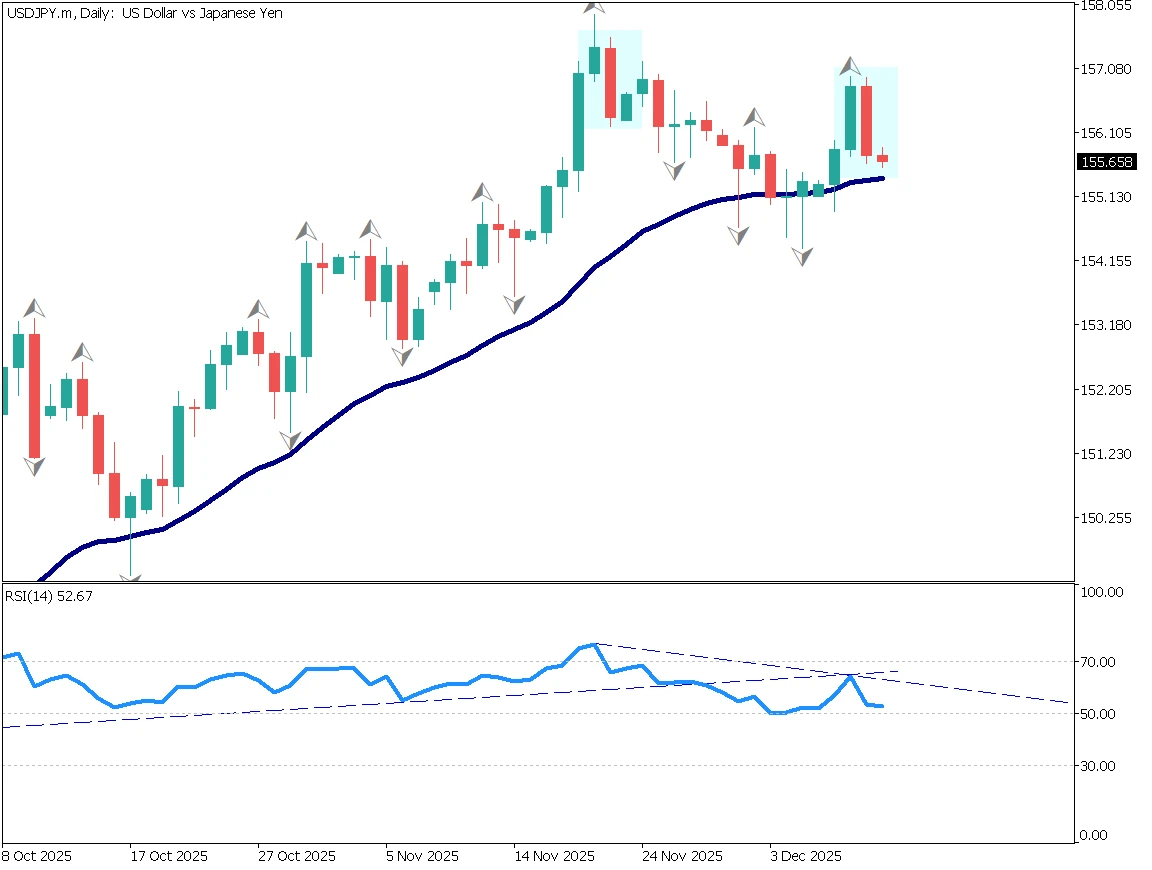
USD/JPY had been rising with support from the 26-day EMA. However, after the Fed's rate cut, dollar selling intensified, pushing the pair down from just below 157 to the mid-155 area.
The candlestick pattern now shows a bearish engulfing formation near the recent high, suggesting a potential double-top pattern. This requires caution.
The rate cut was largely priced in, so the impact was limited. The market is now focused on the upcoming Bank of Japan meeting, where a rate hike is expected and already priced in. If the U.S. cuts rates while Japan hikes, downward pressure on USD/JPY is likely to grow. A short-term downtrend would not be surprising.
RSI is currently supported around 50. If it breaks below 50, USD/JPY may fall toward the 152 range.
Day Trading Strategy for USD/JPY
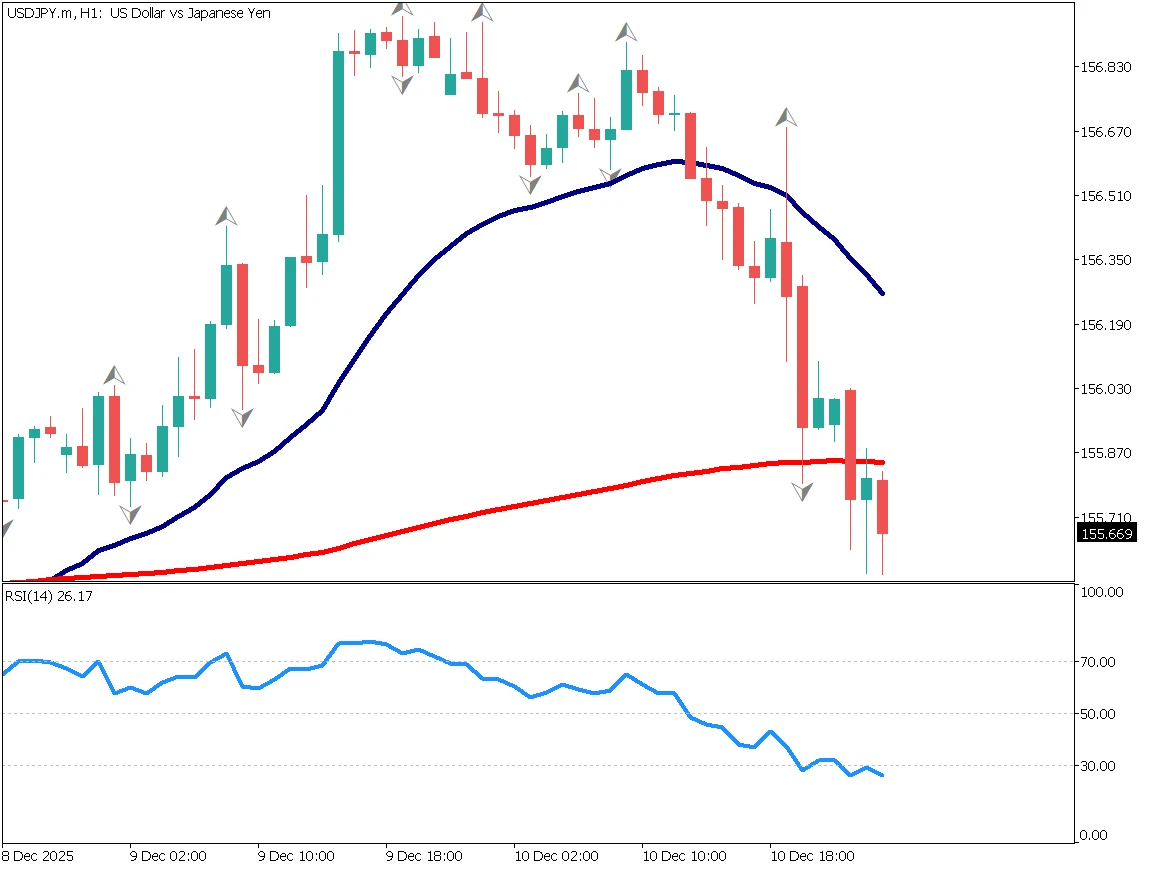
RSI is around 26, indicating the decline is somewhat overheated. A pause may lead to dip-buying. Until the BOJ meeting takes place, a bearish stance is preferred.
USD/JPY has already broken below the 240-day EMA, which may now act as resistance.
A possible trade scenario is: Sell near 155.87, Stop-loss if price exceeds 156, Take profit around 153.
Today's Key Events
| Event | Time |
|---|---|
| Speech by the Governor of the Bank of England | 18:50 |
| U.S. Initial Jobless Claims | 22:30 |
Ready to trade?
Open live accountRelated Analysis
![[Special Edition] When Will the Bank of Japan's Next Rate Hike Come?](/_next/image/?url=%2Fimages%2Fmarket-analysis%2F20251031USDJPYDAY.webp&w=3840&q=75&dpl=dpl_77ssCXjCb12GKyGPb1A64J67PTHc)
[Special Edition] When Will the Bank of Japan's Next Rate Hike Come?
The Bank of Japan decided to keep its policy rate unchanged at around 0.5%. Governor Kazuo Ueda stated that the BOJ would closely watch wage negotiations in next spring's "Shuntō" before making any policy changes.
USD/JPY Faces Resistance as BOJ Keeps Policy Unchanged
The Bank of Japan decided to maintain its current policy settings. Markets are focusing on whether the Governor will mention a possible rate hike in his press conference. Meanwhile, although the U.S. has already begun rate cuts, opinions differ on a possible additional cut in December.
USD/JPY Forms Double Top, Downtrend Ahead?
USD/JPY is forming a double top pattern, trading in the low 151 range. Goldman Sachs forecasts a potential return to around 100 if interest rates continue rising over the next decade. The FOMC meeting is scheduled for early tomorrow with a rate cut already priced in.
This material is for informational purposes only and does not constitute investment advice. Trading leveraged products involves significant risk of loss. Past performance is not indicative of future results.