USD/JPY Continues to Decline as Markets Brace for U.S. Jobs Data

Daily Market Analysis
Expert analysis of today's market movements and trading opportunities
Daily Market Analysis
Expert analysis of today's market movements and trading opportunities
Fundamental Analysis
- Markets are closely watching the U.S. employment report
- Whether the data is too strong or too weak, sharp market moves are possible
- Ideally, the market is looking for a moderate slowdown
Will U.S. Employment Data Show Moderate Slowdown?
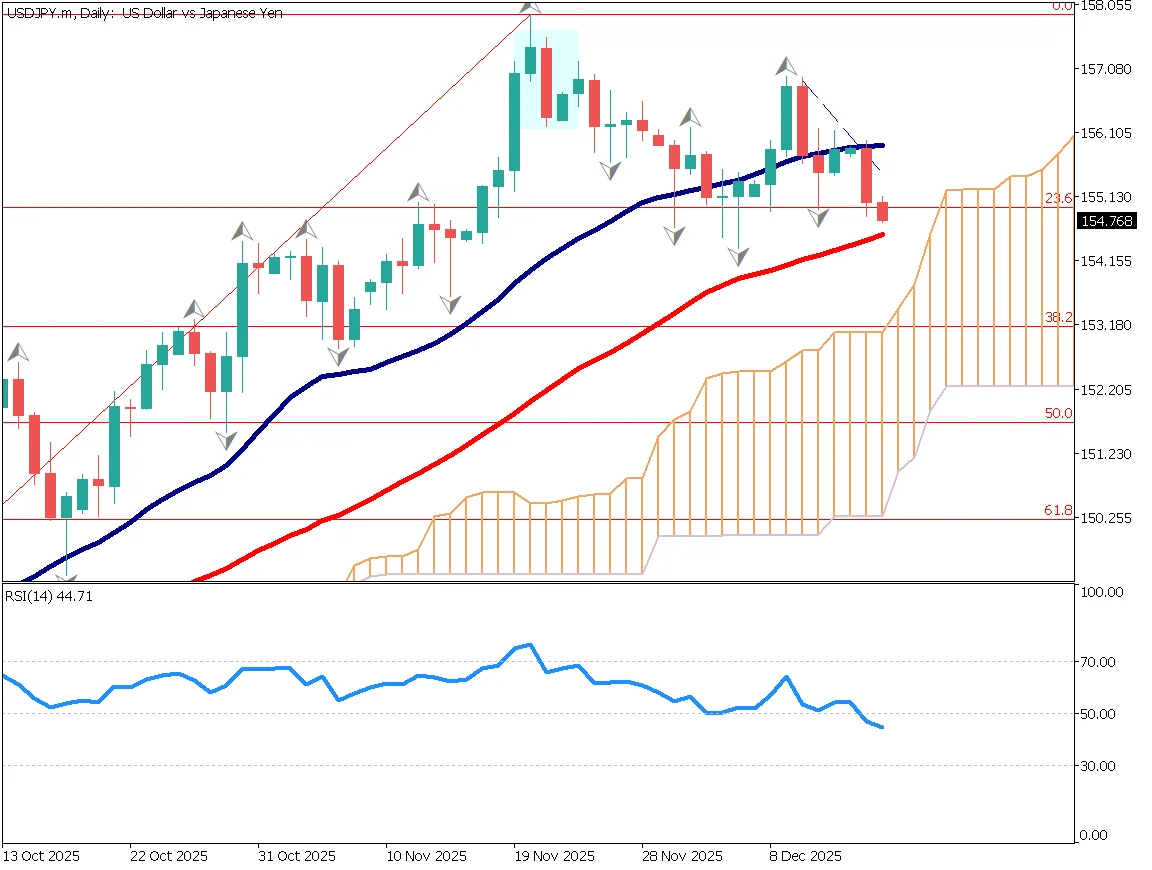
Expectations of a Bank of Japan rate hike are firm, which is likely to put a brake on the yen's depreciation. USD/JPY has broken below the 26-day moving average and is approaching the 52-day moving average. Lower highs are clearly forming, and attention is focused on whether the price will break below the 52-day line.
The pair has also fallen below the 23.6% Fibonacci retracement level, which had been acting as a key support. This opens the way toward the 38.2% level. A thick Ichimoku cloud lies ahead, making today's U.S. employment data a key test.
RSI has fallen below 50, indicating that the bearish trend is strengthening.
From a fundamental perspective, if the U.S. employment data is strong, expectations for rate cuts may fade, leading to lower stock prices and renewed dollar selling. If the data is weaker than expected, concerns about an economic slowdown could also trigger stock declines and dollar selling.
The key question is whether the data will be seen as a "moderate slowdown" by the market.
Volatility is likely to rise not only in USD/JPY but also in the gold market, requiring close caution.
Day Trading Strategy
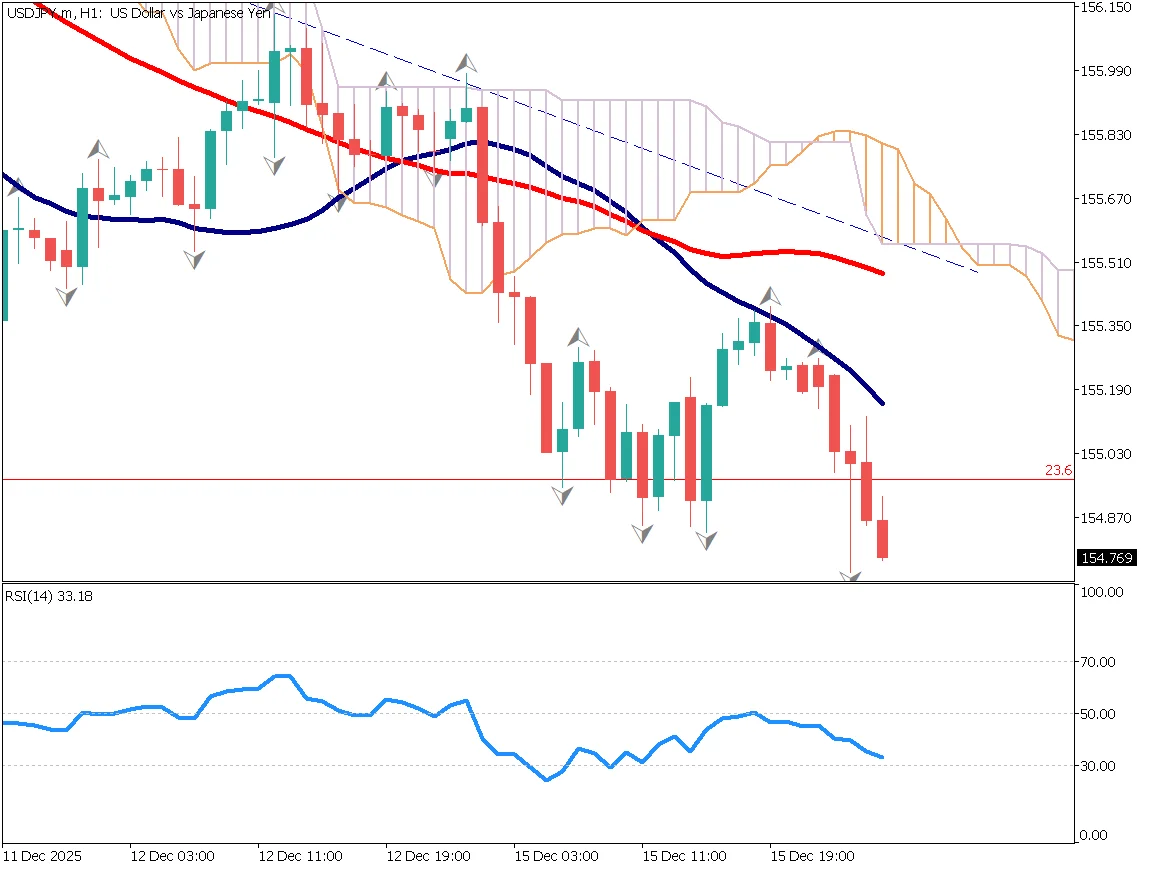
Based on Dow Theory, the recent low has been broken, confirming a downtrend. This suggests that the decline may continue. As noted in the previous daily report, RSI has failed at the 50 level and is falling again.
RSI 50 is a critical level. Although RSI is currently around 33, this is not a situation suitable for counter-trend buying. As long as the 26-day moving average acts as resistance, a bearish bias should be maintained. A decline toward the 150 level is possible.
Key Economic Events Today
| Economic Indicator / Event | Time |
|---|---|
| U.S. Employment Report | 22:30 |
| U.S. PMI | 23:45 |
Ready to trade?
Open live accountRelated Analysis
![[Special Edition] When Will the Bank of Japan's Next Rate Hike Come?](/_next/image/?url=%2Fimages%2Fmarket-analysis%2F20251031USDJPYDAY.webp&w=3840&q=75&dpl=dpl_77ssCXjCb12GKyGPb1A64J67PTHc)
[Special Edition] When Will the Bank of Japan's Next Rate Hike Come?
The Bank of Japan decided to keep its policy rate unchanged at around 0.5%. Governor Kazuo Ueda stated that the BOJ would closely watch wage negotiations in next spring's "Shuntō" before making any policy changes.
USD/JPY Faces Resistance as BOJ Keeps Policy Unchanged
The Bank of Japan decided to maintain its current policy settings. Markets are focusing on whether the Governor will mention a possible rate hike in his press conference. Meanwhile, although the U.S. has already begun rate cuts, opinions differ on a possible additional cut in December.
USD/JPY Forms Double Top, Downtrend Ahead?
USD/JPY is forming a double top pattern, trading in the low 151 range. Goldman Sachs forecasts a potential return to around 100 if interest rates continue rising over the next decade. The FOMC meeting is scheduled for early tomorrow with a rate cut already priced in.
This material is for informational purposes only and does not constitute investment advice. Trading leveraged products involves significant risk of loss. Past performance is not indicative of future results.