Gold faces strong resistance, failing to break above $4,850

Daily Market Analysis
Expert analysis of today's market movements and trading opportunities
Daily Market Analysis
Expert analysis of today's market movements and trading opportunities
Fundamental Analysis
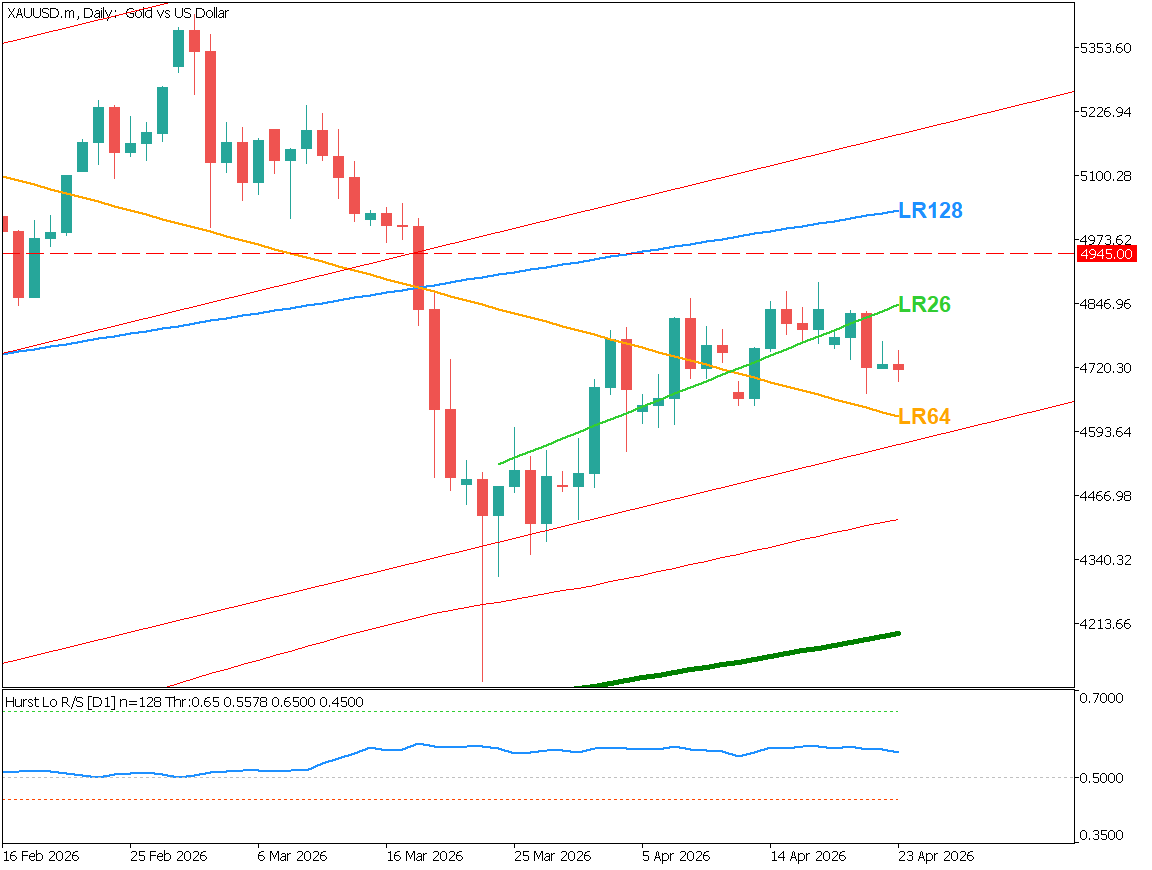
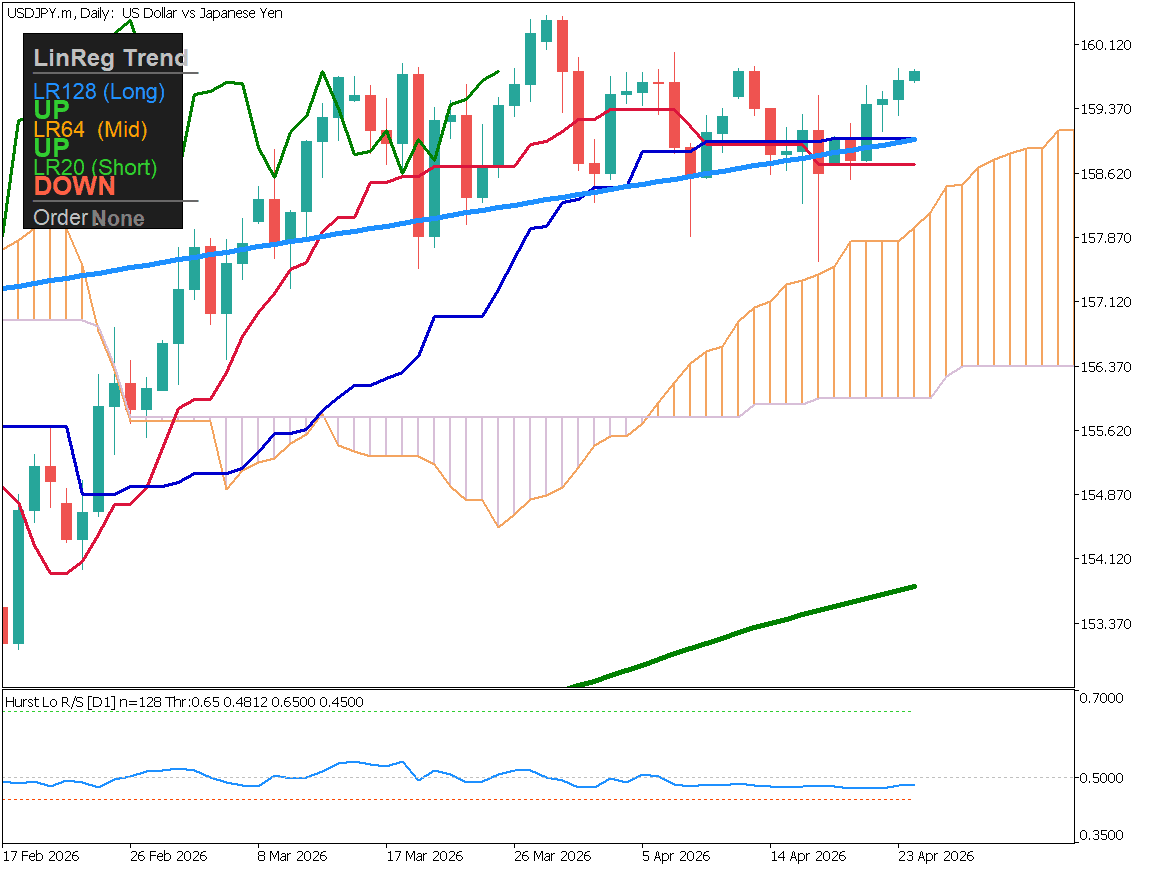
- Gold is rising in the short term, but the medium-term trend remains downward, showing strong resistance. It has failed to break above $4,850, and a drop below $4,500 could open room toward $4,200. The Hurst exponent suggests only a weak trend, while the 1-hour chart also indicates a bearish bias, with the 240MA acting as resistance. Selling on rallies remains the preferred strategy. However, market direction may shift depending on geopolitical headlines, particularly US-Iran developments, though the overall bias remains USD bullish and gold bearish.
Analyzing the daily chart of gold: while gold is rising in the short term, the medium-term 64-period linear regression remains downward sloping. This indicates increasing resistance at higher levels, with the potential for renewed downside momentum. The Hurst exponent stands at 0.556, suggesting a slight trend presence, but not a strong one. If gold breaks below $4,500, it may target new lows around $4,200.
Ongoing geopolitical tensions between the US and Iran continue, and market direction can shift significantly based on news headlines.
Overall, the strategy remains bullish on the US dollar and bearish on gold.
Selling on rallies, but dependent on headlines
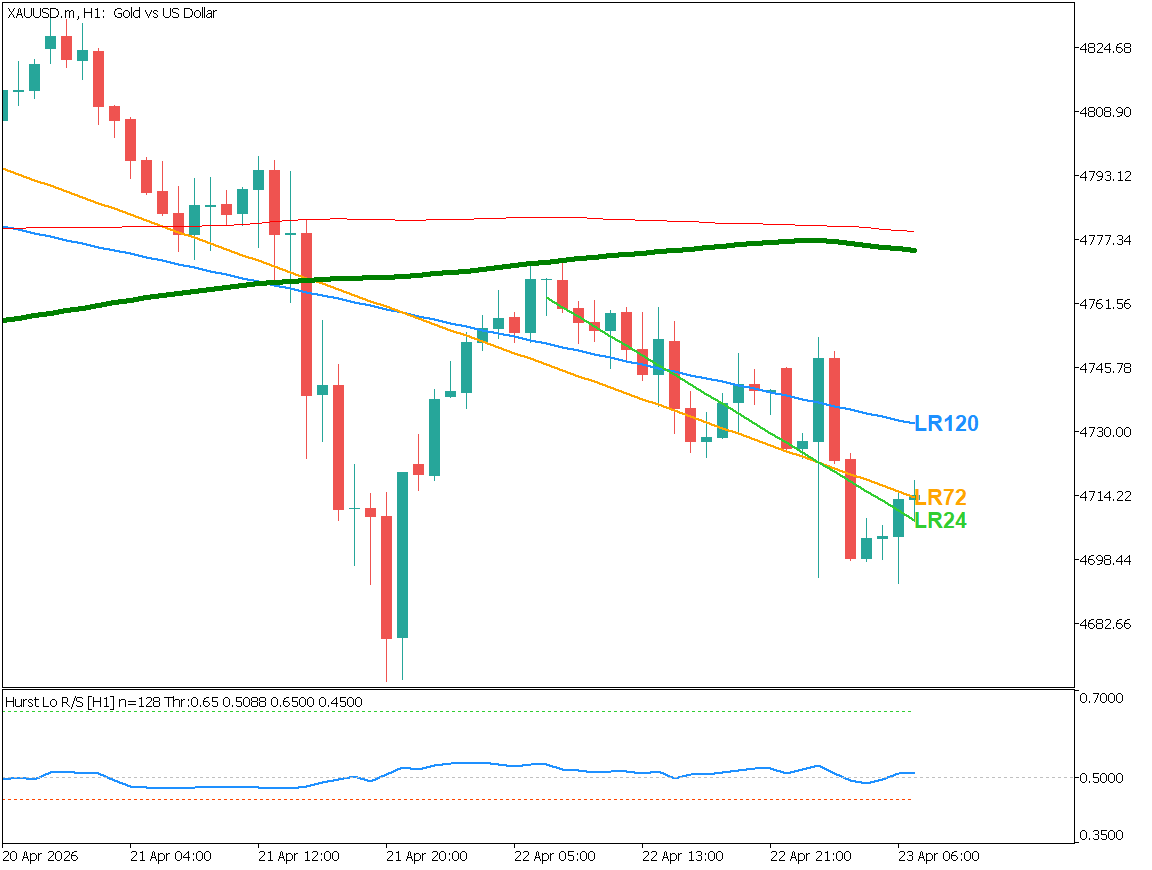
Analyzing the 1-hour chart: the Hurst exponent is 0.51, indicating a market with strong randomness. Long-, medium-, and short-term linear regressions are all trending downward, highlighting persistent resistance even on lower timeframes. Another key point is the rejection at the 240-period moving average. As long as price remains below the 240MA, a bearish outlook is preferred.
If signs of economic slowdown appear in the US or globally, USD strength is expected to increase.
From a fundamental perspective, the strategy is to look for opportunities to sell at retracement highs, favoring the downside.
Ready to trade?
Open live accountRelated Analysis
This material is for informational purposes only and does not constitute investment advice. Trading leveraged products involves significant risk of loss. Past performance is not indicative of future results.