Wait and see until the BOJ policy meeting, USDJPY falls back to a high of JPY137.0【March 6, 2023】
March 06, 2023
Markets Analysis
目次
Fundamental Analysis
- U.S. stock markets were sharply higher during the week last week, with the NASDAQ and S&P 500 rising across the board
- Fed board member’s reference to the timing of the U.S. rate hike halt has had an impact, spreading optimism in the market
- Markets anticipate a rate hike to 5.4% by summer
- US 10yr Treasury yields fall, USD/JPY fails to rise above JPY 137
- Dollar/Yen profit-taking around JPY 137
- As yesterday the 5th was a Sunday, dollar buying by actual demand (goto day) may intensify
- USDJPY opens a window and rises, opening at JPY 135.90
- In the foreign exchange market, the pound dollar strengthens against the U.S. dollar
- Gold rises, dollar index declines, becoming more undervalued
- Gold Resistance at USD 1,863.00; Downtrend Ends?
- China’s National People’s Congress Opens, Growth Rate Set at Around 5
- China’s economic indicators are good, expectations for post-Corona economic growth grow stronger
- Crude oil rises sharply, stays in a range, but the downside is gradually cutting off
- Translated with www.DeepL.com/Translator (free version)
Technical Analysis
No important U.S. economic indicators are scheduled today. The U.S. stock market was significantly higher last week, and there is a high probability that the market will remain firm this week as well. In addition, China’s National People’s Congress is being held, which is expected to be positive for the Australian dollar, which has close ties with the Chinese economy.
Dollar/Yen (USDJPY)
Analyze the hourly chart of the USDJPY. Today’s expected range is JPY 134.85 to JPY 137.12. The pair is rebounding at the 200 moving average and has opened a window to the upside today. With the dollar trending lower, it is doubtful that the upward momentum will continue.
In addition, analysis of the RSI shows divergence. It is near 43, a level that indicates a downtrend, and some material is needed for the price to rise.
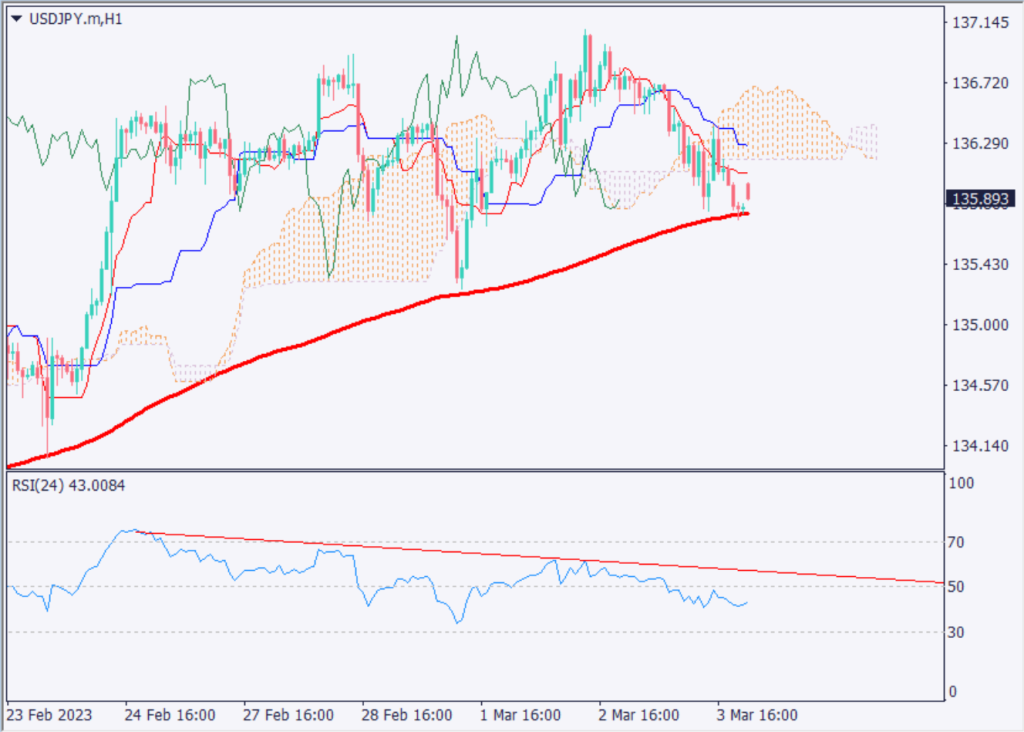
| Estimated range | JPY 134.85 – JPY 137.12 |
| Resistance line | JPY 136.56 |
| Support line | JPY 135.44 |
GOLD (XAUUSD)
Drawing Bollinger Bands on the hourly chart of Gold shows that a band walk has occurred and the upward trend is strengthening. On the other hand, the daily chart shows that the price is hovering around the +2σ of the Bollinger Band, which could lead to a temporary sell-off due to profit-taking.
Since the support line is near USD 1,845, we should wait for a push. the downtrend that occurred in February is over, and the next trend may well occur.
The focus will be on whether the price can rise above USD 1,862.00.
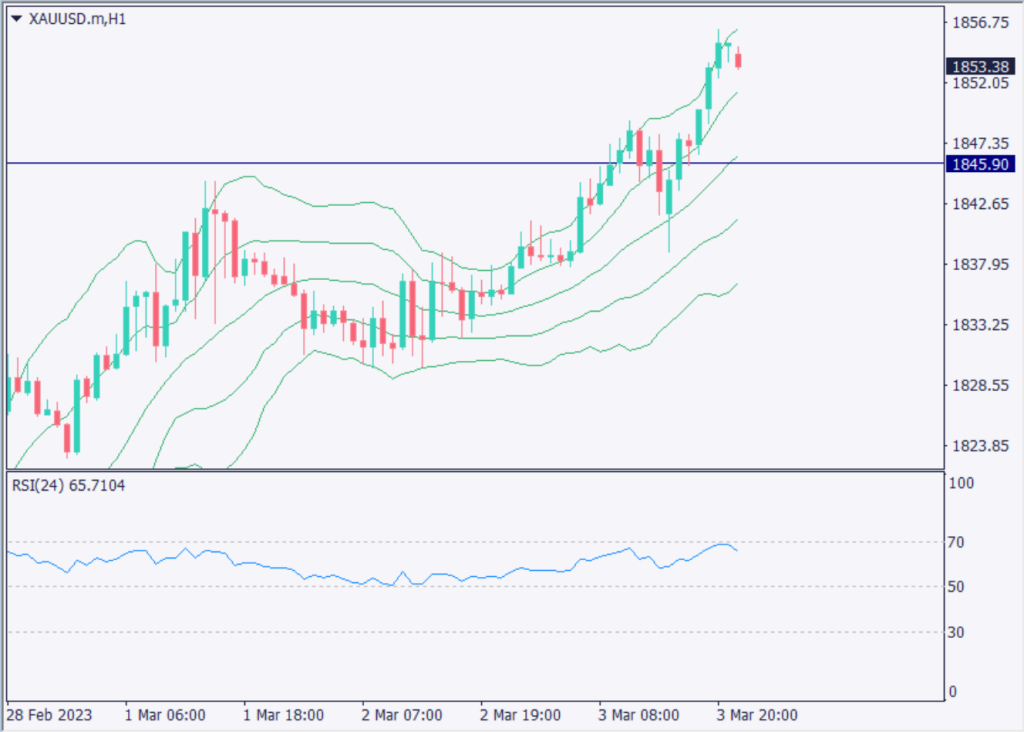
| Estimated range | USD 1,837.50 – USD 1,871.00 |
| Resistance line | USD 1,862.60 |
| Support line | USD 1,845.90 |
GBPUSD
The pound dollar continues to appreciate against the dollar. Last week, the UK reached an agreement on logistics in Northern Ireland, and the fundamentals for the pound dollar are favorable. On a daily basis, the market is in a narrow range, but we expect it to rise in the medium term.
Today, the pair opened a window and fell, but is now filling the window. The expected range is USD 1.192-1.212. the RSI is at 56, indicating an upward trend, so upside is likely. USD 1.207 and USD 1.2085 are previous highs and could act as resistance zones, so watch out for a selloff.
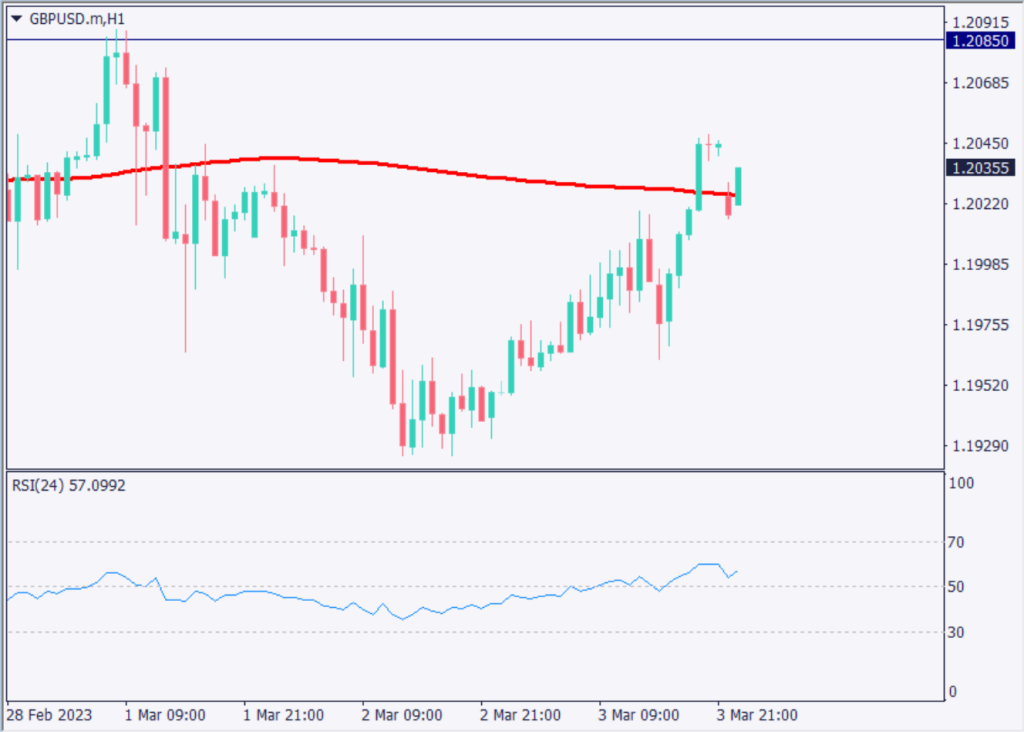
| Estimated range | USD 1.192 – USD 1.212 |
| Resistance line | USD 1.207 |
| Support line | USD 1.197 |
*Trading advice in this article is not provided by Milton Markets, but by Shu Fujiyasu Jr., a certified technical analyst.