U.S. stock prices rise, U.S. financial authorities waver between inflation and bank bailouts【March 15, 2023】
March 15, 2023
Markets Analysis
目次
Fundamental Analysis
- Major U.S. Stock Indexes Rise, Bank Failure Turmoil Set to Settle
- U.S. Core CPI Surpasses Estimates, Puts Pressure on FOMC to Raise Interest Rates
- U.S. government issued a statement saying that deposits above the guaranteed amount will be fully protected
- Focus on whether a chain of failures of smaller regional banks with similar management structures will occur
- Difficult choice between inflation control and banking system stabilization at next FOMC meeting
- A rate hike would destabilize the banking system, while a halt in rate hikes would fail to contain inflation
- The yen will weaken against the U.S. dollar in reaction to the previous day’s large price move
- Nikkei Stock Average pushing near 200-day moving average
- Crude oil sharply lower, below the lower end of the range due to expected lower US demand
- Bitcoin surged above recent highs, temporarily hitting the USD 26,000 level
- US drone reportedly shot down by Russian military concerns, cautioning against worsening geopolitical risks
Technical Analysis
Analyzing currency strength and weakness, a number of fundamental factors are overlapping and the market is trying to find a sense of direction. It is a difficult market development. Will Crude Oil break below the lower end of its range and test recent lows? The USD/JPY will be watched to see if risk aversion resumes after the end of the goto day’s movement.
crude oil (USOUSD)
Crude oil is sharply lower. The issue is easy to understand both technically and fundamentally at this point. Technically, it has broken the lower end of the range, and watch for a break above the recent low of USD 70.2.
Looking at the highs in the range, we can see that the highs are cutting down to USD 82.6 and USD 80.96. Taking into account the fundamentals, we can conclude that the probability of a decline is high.
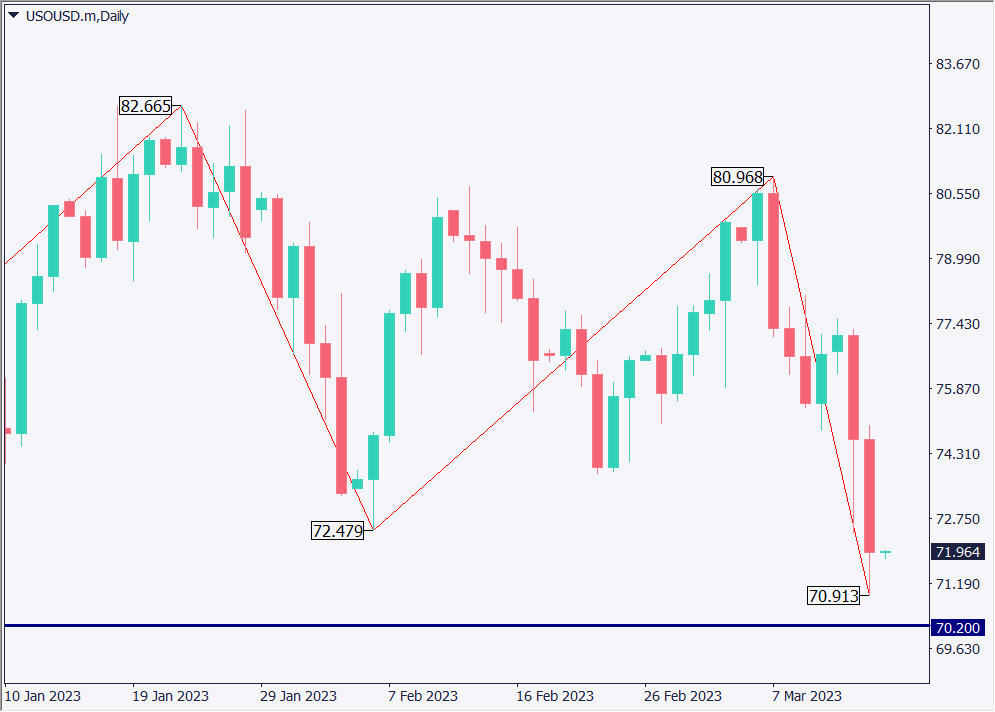
| Estimated range | USD 70.24 – USD 74.00 |
| Resistance line | USD 73.00 |
| Support line | USD 71.42 |
US dollar/JPY (USD/JPY)
At the time of writing, the dollar’s and the yen’s strength are in a state of struggle, making it difficult to discern a sense of direction. Drawing the moving average and Fibonacci Expansion, the USDJPY has a “negative + crosshair + positive” near the moving average and is rebounding in the 4-hour time frame. The 100% line of the Expansion is near JPY 140.35.
Is optimism spreading after the announcement of the US government’s bailout package? However, it will depend on future news, and the focus will be on the next FOMC meeting.

| Estimated range | JPY 133.25 – JPY 135.45 |
| Resistance line | JPY 135.02 |
| Support line | JPY 134.12 |
Bitcoin (BTC/USD)
Bitcoin rallied significantly on the weaker US dollar and temporarily exceeded its recent highs. However, there is selling pressure on the upside, and an upper mustache is emerging. If risk-on moves spread again, bitcoin may turn to sell-off.
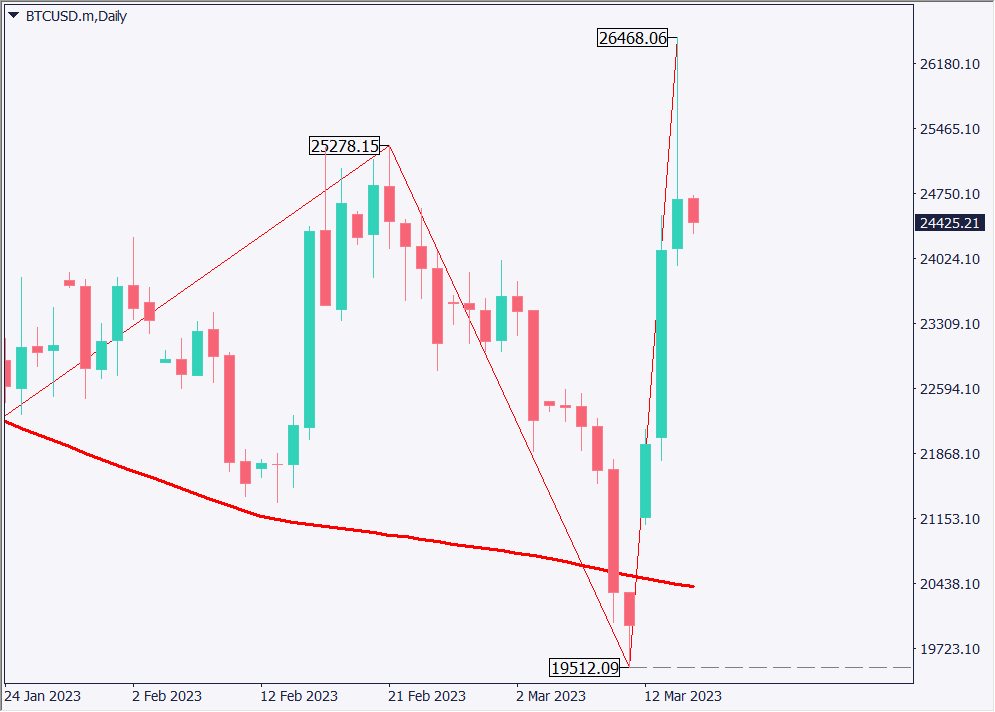
| Estimated range | USD 23520 – USD 25750 |
| Resistance line | USD 25260 |
| Support line | USD 24120 |
Today’s Important Economic Indicators
| Economic Indicators and Events | JST (Japan Standard Time) |
| U.S. Retail Sales U.S. Producer Price Index (PPI) | 21:30 |
*Trading advice in this article is not provided by Milton Markets, but by Shu Fujiyasu Jr., a certified technical analyst.