Stock prices rise on risk-on movement as a series of support measures for ailing banks are announced.【March 17, 2023】


目次
Fundamental Analysis
- U.S. Stock Indexes Rise; Nasdaq Continues 3-Day Advance
- U.S. Bank Stocks Calm Down, Averting a More Serious Decline Expected
- Nikkei 225 and European indices also rise across the board
- U.S. bank First Republic reportedly seeking support measures
- Swiss Central Bank to Provide ¥7 Trillion in Liquidity to Credit Suisse
- ECB to raise rates by 0.50% as planned
- Despite turmoil over European bank stocks, priority given to inflation control
- ECB’s Additional Rate Hike May Impact Other Bank Balances
- USD/JPY jumps from 131 to 133 on risk-on move to buy dollars
- Ahead of the FOMC meeting, will the weekend force more adjustment?
- Support announced does not eliminate concerns, watch for more news in the coming days
Technical Analysis
Overall, risk was on the move, with the dollar strengthening and stocks rising. On the other hand, gold and the yen, which had been bought as safe assets, were sold off. ECB President Lagarde said that there is no trade-off between inflation control and financial stability, and all eyes are on whether the FOMC will raise interest rates.
Bitcoin (BTCUSD)
The daily chart of Bitcoin shows a bottoming out of the market, a move that is expected to lead to further gains. Of note is the price window that occurred during the sharp drop on June 13, 2022. The window is open at USD 27,500 – USD 29,000 and has not been filled at the time of writing.
We expect the market to move higher in an attempt to fill this window, and the fact that it has rallied since rebounding at the 200-day moving average is another technical point at which we can expect a move higher. The trade policy is to buy on the push.

| Estimated range | USD 23500 – USD 28850 |
| Resistance line | USD 26500 |
| Support line | USD 24000 |
Dollar-Yen (USDJPY)
The dollar is sensitive to financial news and is moving left and right. The market continues to be volatile. Analyzing the daily chart, the pair is falling back at the 200-day moving average, and the chart shape shows a downtrend.
On the other hand, if the FOMC raises interest rates next week, the market will be aware of the interest rate differential and a temporary rise is expected. At this stage, the market is likely to remain in a range. A break below the cloud could strengthen the downward momentum, so caution should be exercised.
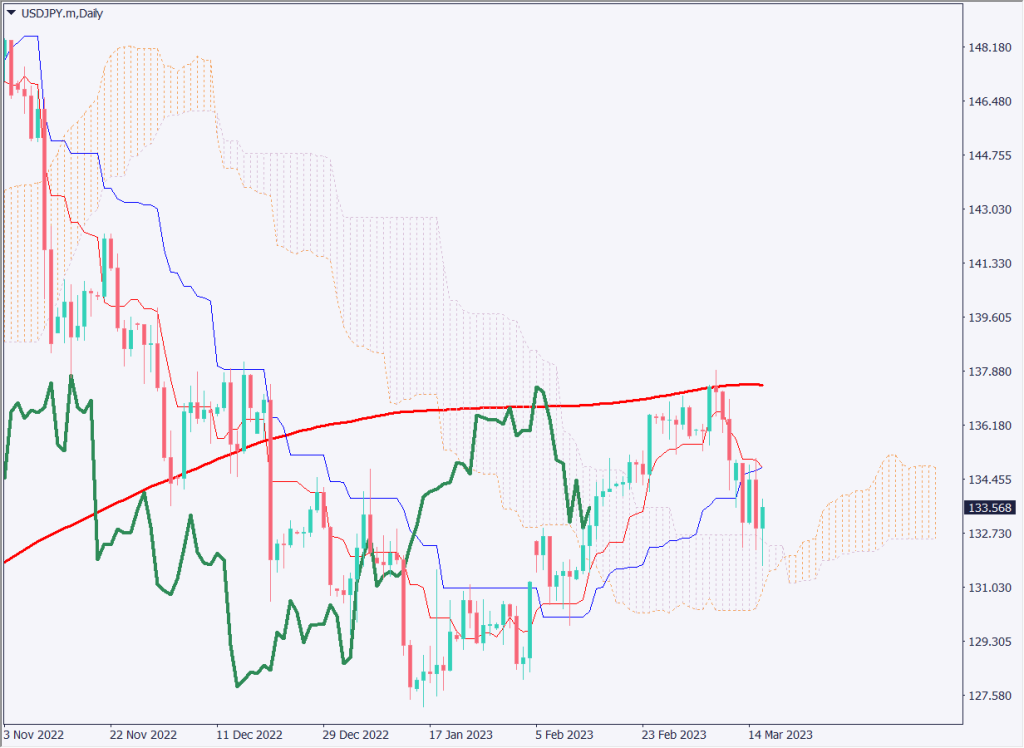
| Estimated range | JPY 132.25 – JPY 135.8 |
| Resistance line | JPY 135.110 |
| Support line | JPY 132.85 |
NASDAQ 100 (NASDAQ)
Analyze the daily chart of the NASDAQ. The NASDAQ 100 Index is an index of companies in the financial sector. It does not move in the same way as the Dow Jones Industrial Average or the S&P 500 and is unlikely to be affected by this banking news. The Nasdaq has been rising for three consecutive days and is aiming for USD 12,700, a major resistance line.
The equilibrium chart shows that the lagging line is in line with the candlestick and the cloud has also broken through; the focus is on whether the price can break above USD 12700. The RSI is at 58, indicating a steady rise.

| Estimated range | USD 12200 – USD 12850 |
| Resistance line | USD 12700 |
| Support line | USD 12320 |
Today’s Important Economic Indicators
| Economic Indicators and Events | JST (Japan Standard Time) |
| EU Consumer Price Index | 19:00 |
*Trading advice in this article is not provided by Milton Markets, but by Shu Fujiyasu Jr., a certified technical analyst.