Dollar Selling as U.S. Rate Hike Cycle Nears End; Central Banks Continue to Raise Interest Rates【March 24, 2023】

目次
Fundamental Analysis
- Major U.S. stock indexes rebounded slightly, with tech stocks in better shape
- Bank of England decided to raise interest rate by 0.25
- Swiss Central Bank decided to raise interest rate by 0.5
- Countries prioritize inflation despite banking concerns
- Dollar selling intensifies as U.S. rate hike cycle comes to an end
- More borrowers have excessive debt; loan officer survey in focus
- Gold closes near USD 2,000 level, affected by dollar selling trend
- Bitcoin Climbs to USD 28,000 Level, Uptrend Strengthens
- Bitcoin nears milestone price point, watch for pullback
Technical Analysis
The dollar is clearly selling off in anticipation of the approaching end of the U.S. interest rate hike cycle. In addition, financial instability has not been dispelled, which has increased demand for safe assets. On the other hand, there is a sense of a lull in the market, as the market has moved significantly from last week to this week. With the end of the fiscal year approaching in Japan, one should pay attention to movements in real demand.
In a market that appears to be moving in complex ways, it will be easier to grasp the overall movement if we broaden our perspective to include daily and weekly time frames.
GOLD (XAUUSD)
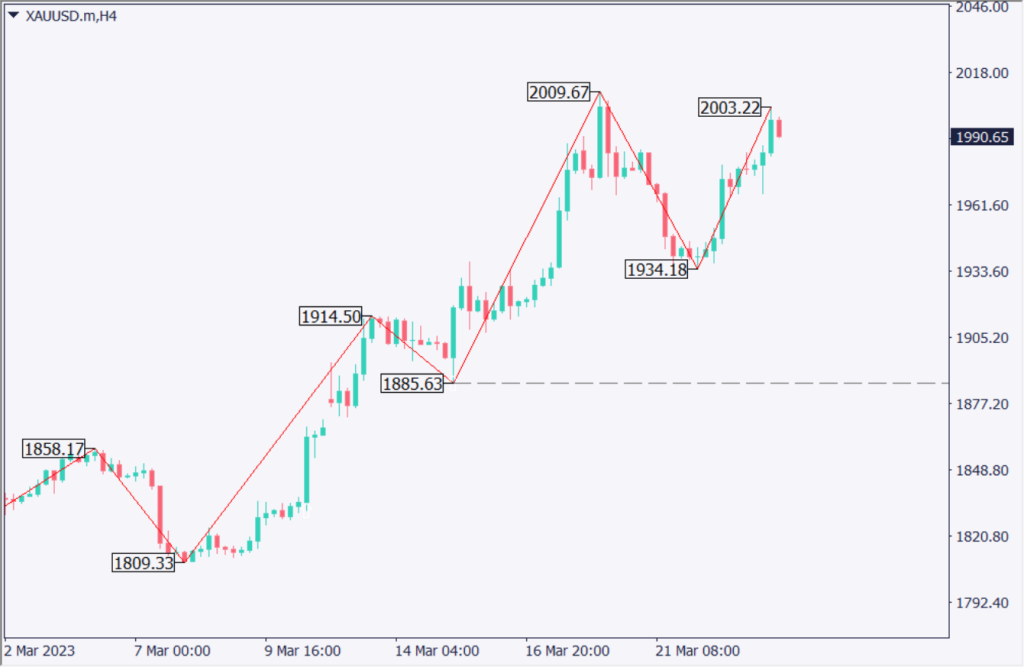
Analyzing the 4-hour chart of Gold, we can apply the Elliott wave: if we consider the price movement from USD 1809.00 as the first wave of propulsion, it now corresponds to the fifth wave. It will be interesting to see if the recent high of USD 2009 can be renewed today.
A large resistance zone awaits at USD 2013.00, and once the price tries to move higher, it may move back down. The long-term direction is up, but we would wait for a deep push and consider buying positions. once the resistance zone between USD 2008.00 and USD 2013.00 is broken, the next resistance zone will be around USD 2060.00, followed by a blank price zone.

| Estimated range | USD 1964.00 – USD 2018.00 |
| Resistance line | USD 2008.00 , USD 2013.00 |
| Support line | USD 1979.00 |
Australian Dollar Yen (AUDJPY)
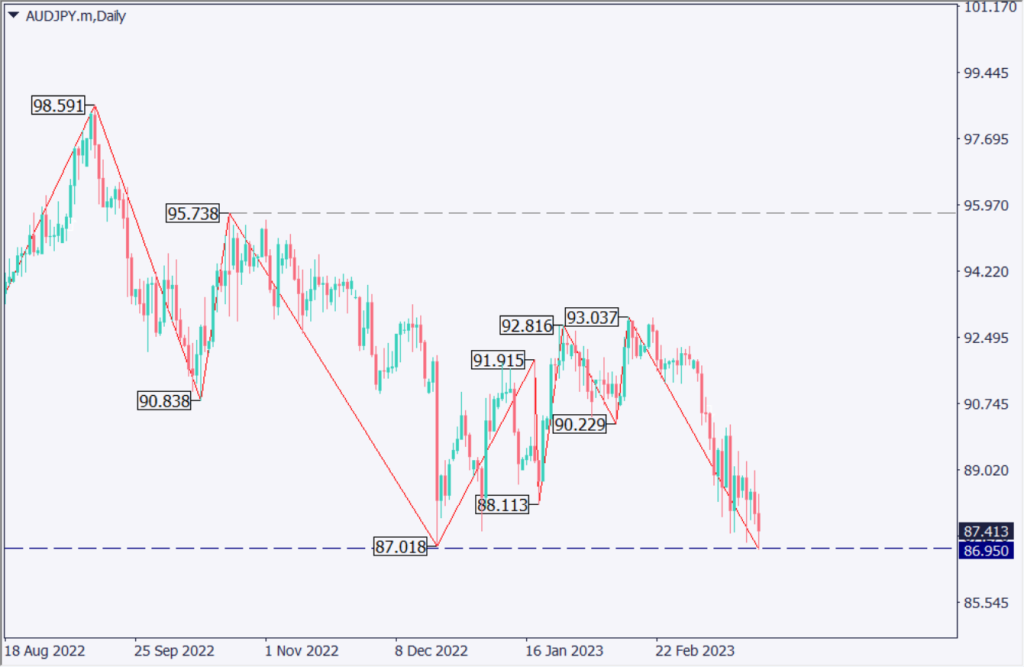
Analyzing the daily chart of the AUDJPY. AUDJPY has been rising and falling every day, but still making lower highs. 86.950 is a big support line, and we do not expect a big decline until the end of this month. 86.950 is a low, and if the price starts to rise, it could form a double bottom and rise to the JPY 90 level.

| Estimated range | JPY 86.65 – JPY 88.50 |
| Resistance line | JPY 87.45円 , JPY 87.97 |
| Support line | JPY 86.80 , JPY 86.93 |
Nikkei 225 (Nikkei Stock Average)
The weekly chart of the Nikkei 225 is analyzed. On the daily chart, there is no sense of direction due to the violent ups and downs, but on the weekly chart, there is a symmetrical triangle of falling highs and rising lows, and the situation is heading toward convergence.
A weekly triangle is a rare occurrence, and could be highly volatile going forward; a reversal above JPY 25,600 is highly likely. Until a break in either direction, the short-term trading policy is.

| Estimated range | JPY 27,000 – JPY 27,800 |
| Resistance line | JPY 27,480 |
| Support line | JPY 27,140 |
Today’s Important Economic Indicators
| Economic Indicators and Events | JST (Japan Standard Time) |
| UK Retail Sales | 16:00 |
| UK Manufacturing PMI | 18:30 |
| Canada Retail Sales | 21:30 |
| U.S. Manufacturing PMI | 22:45 |
*Trading advice in this article is not provided by Milton Markets, but by Shu Fujiyasu Jr., a certified technical analyst.