U.S. regional bank results stronger than expected, dollar continues to appreciate and USDJPY is eyeing 135 JPY【April 18, 2023】
April 18, 2023
Markets Analysis
目次
Fundamental Analysis
- Dow Jones Industrial Average and S&P 500 post small gains; Nasdaq slips
- U.S. corporate earnings are relatively strong; U.S. regional banks also report strong results
- Portugal and Hungary ban Ukrainian grain imports, EU reacts
- The U.S. dollar strengthened across the board, and the JPY continued to sell off
- Crude oil slumps, reports of production cutbacks growing in anticipation of lower demand
- Gold falls below the USD 2,000 level, unable to hold the USD 2,000 level due to accelerating dollar strength
Technical Analysis
Overall, the dollar continues to strengthen; it may continue to do so until the May FOMC meeting. Important economic indicators will be released today outside the US. The dollar is now at a level where 135 JPY is in sight. Better-than-expected results from U.S. regional banks may also be a source of relief.
Dollar-Yen (USDJPY)
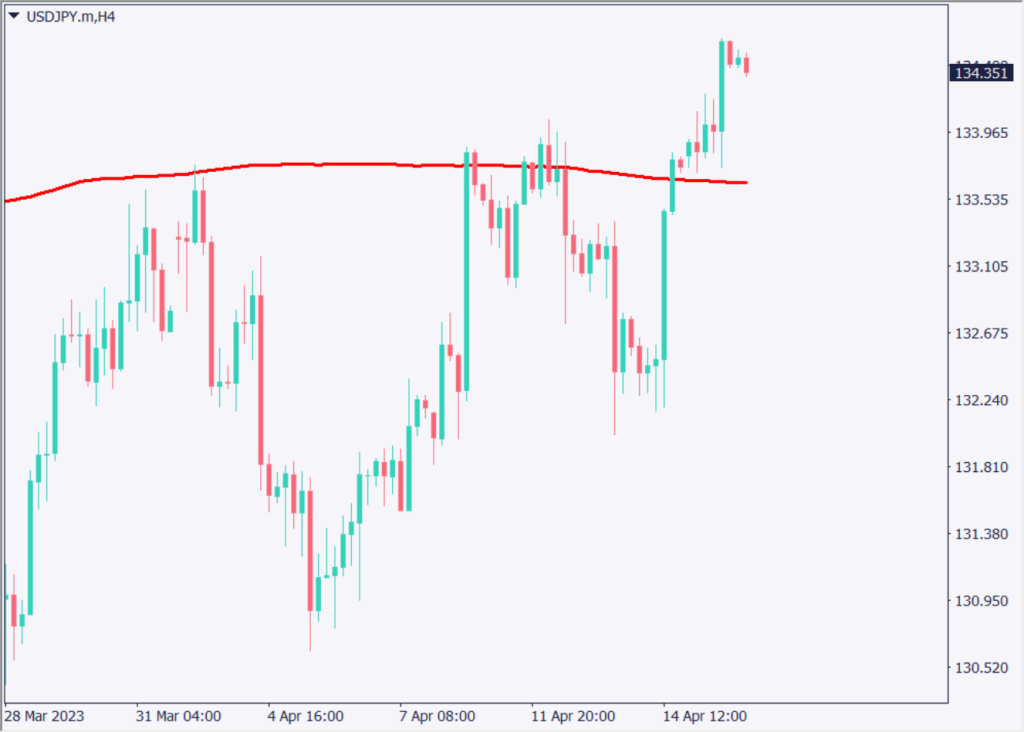
Analyze the 4-hour chart of the dollar-yen. A clear break above the moving averages confirms that the area around 133.50 has turned into a support zone. The interest rate differential between the U.S. and Japan is once again in focus and may remain steady until the next FOMC meeting. In addition, strong U.S. economic indicators and corporate earnings may also have an impact on the dollar’s strength.
Going forward, the resistance zone will be around JPY 135, a milestone price. Today, we would like to imagine a rotation to the JPY 135 area with a push-buy policy.

| Estimated range | JPY 133.00 – JPY 135.70 |
| Resistance line | JPY 135.00 |
| Support line | JPY 133.45 |
Australian-Dollar (AUDUSD)
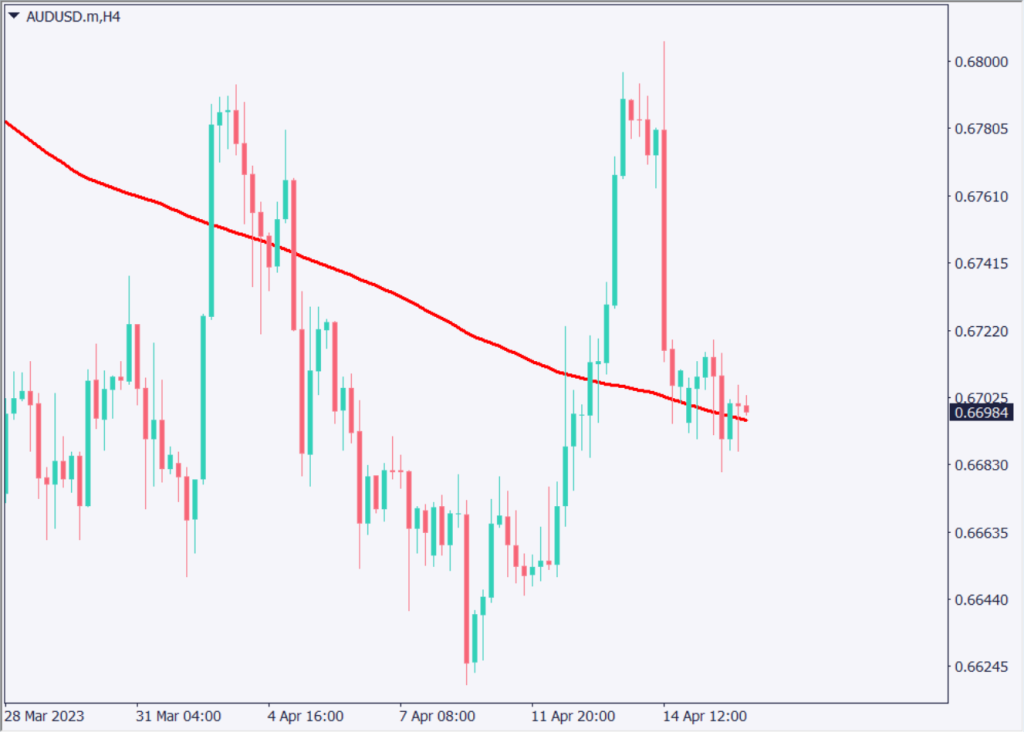
Analysis of the 4-hour leg of the Australian dollar. Depending on today’s Bank of Australia minutes, the market is forming a large range at the time of writing. The moving averages are the ones to watch. The market is currently directionless, but if the minutes discuss another interest rate hike, it will be a buy for the Australian dollar.
On the other hand, if the minutes of the meeting do not include a rate hike, and if the meeting discusses a policy of rate cuts in the future, the AUD may break below the moving average and fall.

| Estimated range | USD 0.6617 – USD 0.6760 |
| Resistance line | USD 0.6725 |
| Support line | USD 0.6678 |
Canadian-Dollar (USDCAD)
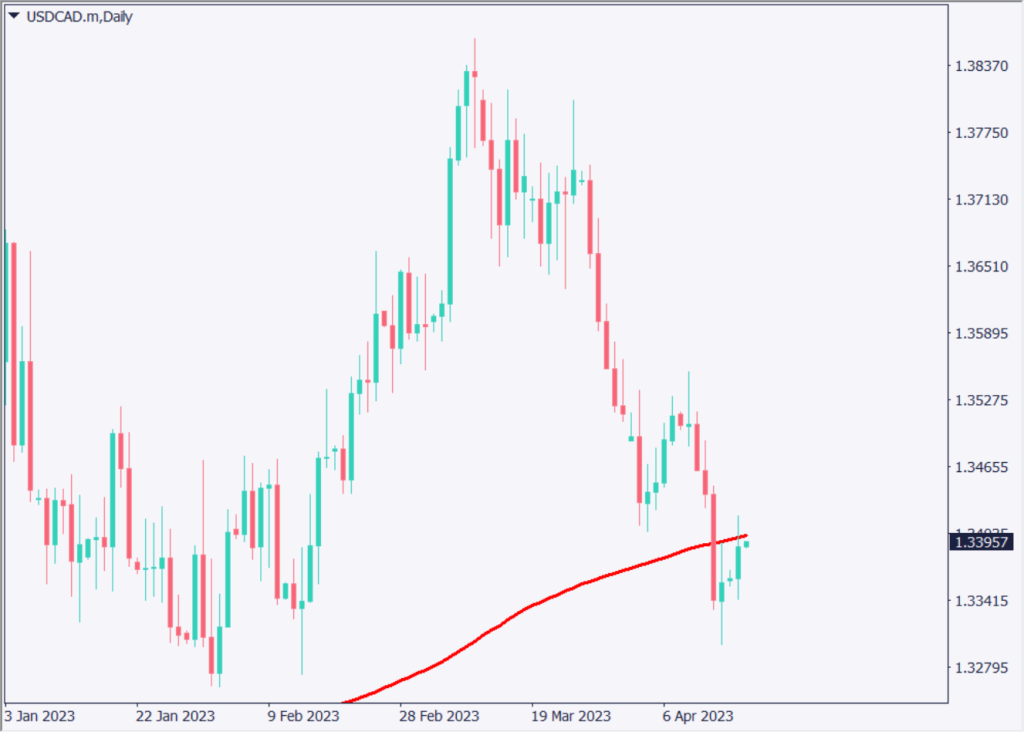
Analyzing the daily chart of the Canadian dollar, the 240-day moving average is acting as a resistance band, which is the right time for a selloff. The Consumer Price Index will be released, and if inflation is rising, it will buy the Canadian dollar, which could lead to a decline.
Looking at the shape of the chart, it seems to be in a downward direction; CAD 1.33950 is a very large resistance/support zone, so which direction it will exit depends on the results of the economic indicators.

| Estimated range | CAD 1.3313 – CAD 1.3468 |
| Resistance line | CAD 1.3430 |
| Support line | CAD 1.3310 |
Today’s Important Economic Indicators
| Economic Indicators and Events | JST (Japan Standard Time) |
| Bank of Australia Minutes | 10:30 |
| UK Unemployment Rate | 15:00 |
| U.S. Housing Starts | 21:30 |
| Canada Consumer Price Index | 21:30 |
*Trading advice in this article is not provided by Milton Markets, but by Shu Fujiyasu Jr., a certified technical analyst.