USDJPY hits a milestone high of JPY137, clearly indicating a weakening trend of the Yen【May 2, 2023】
May 02, 2023
Markets Analysis
目次
Fundamental Analysis
- First Republic Bank of the U.S. fails, not tilting toward risk-off
- Major U.S. Stock Indexes Slightly Lower, Waiting for FOMC Meeting
- EURUSD pauses in its rally, adjustment in the 4-hour chart
- EURJPY may fall if EU CPI shows slower inflation
- Australian policy rate is expected to remain unchanged; focus on the release of the resumption outlook
- Bitcoin falls sharply; decision to buy U.S. regional banks may pause in safe-haven asset purchases
Technical Analysis
As the fourth U.S. regional bank to fail, the possibility of a risk-off tilt was undeniable, but rather, the dollar was tilted higher in favor of the resolution of the matter. In the overall foreign exchange market, the JPY’s depreciation trend became clear and the JPY was sold.
Dollar-Yen (USDJPY)
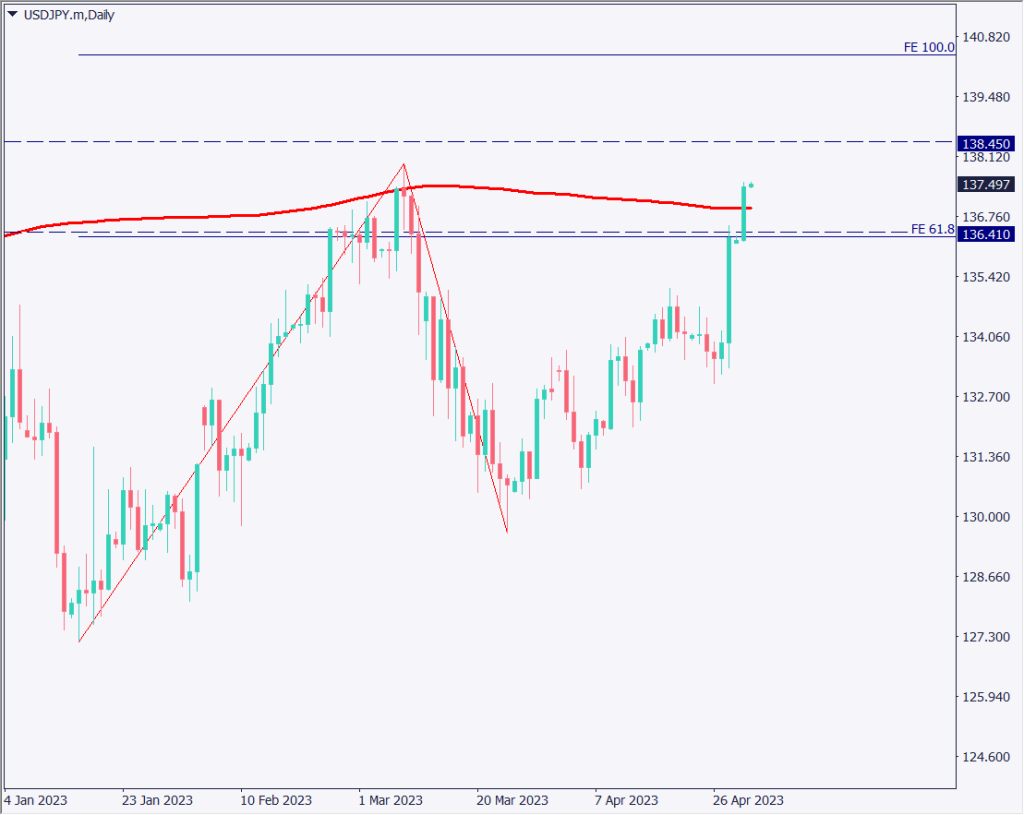
The USDJPY is above its 240-day moving average and has reached the March 2023 high. If the yen continues to weaken, the JPY 140 level is within sight.
The market tends to react strongly to materials that favor the direction of the trend, and this could be taken as a signal that the USDJPY market is tilting upward. While there is a possibility that a temporary adjustment may occur, we would like to buy on the downside if the price falls to the moving average line.

| Estimated range | JPY 136.41 – JPY 138.45 |
| Resistance line | JPY 138.00 |
| Support line | JPY 136.90 |
Euro-Yen (EURJPY)
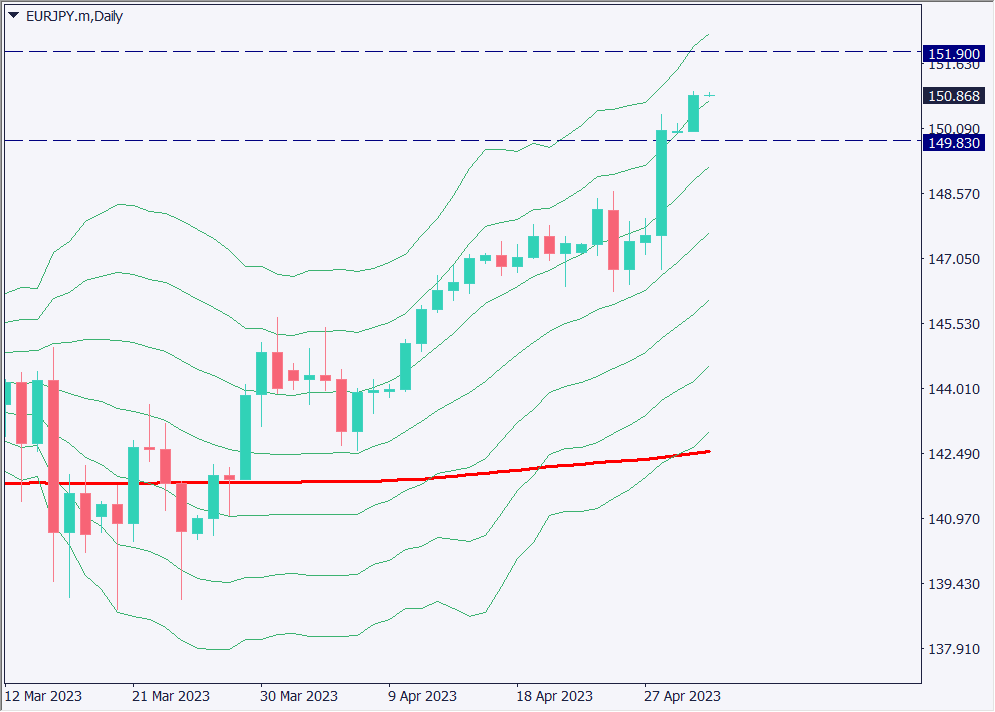
Analyze the daily chart of the Euroyen. An upward trend is occurring and a band walk is also occurring on the Bollinger Bands. The expected range for today is 151.90 as the upper guideline. We would like to close at around +3σ of the Bollinger Band.
The band walk at +2σ to +3σ suggests a strong upward trend, and we expect the trend to be more favorable to the upside today. However, we are also certain that the price is at a higher level, so we would like to take a wait-and-see approach once the price breaks below +2σ.

| Estimated range | JPY 149.83 – JPY 151.90 |
| Resistance line | JPY 151.75 |
| Support line | JPY 150.35 |
Canadian-Yen (CADJPY)
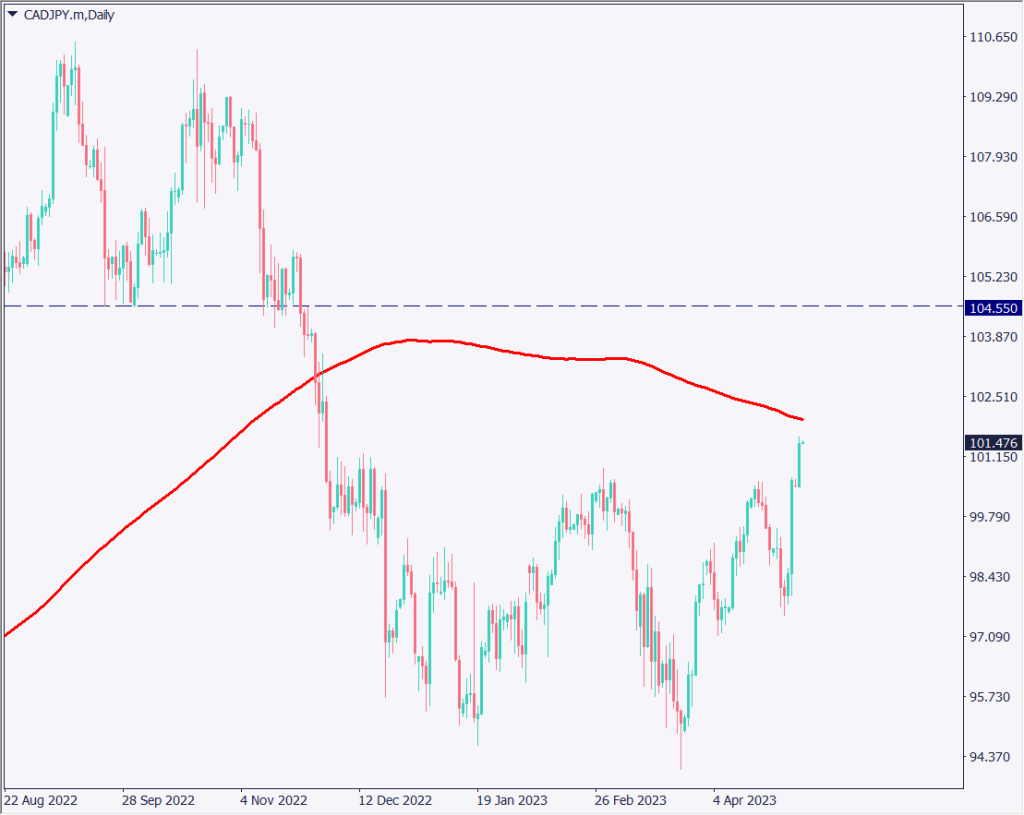
Analyzing the daily chart of the Canadian Yen. The Canadian yen is also on an upward trend due to the weaker yen. The medium- to long-term chart shape confirms that a double bottom has been formed. Currently, the price has exceeded the neckline and is continuing to rise.
The moving average line is waiting in the wings as a resistance zone, but if the price breaks above the moving average line, JPY 104.550 is likely to be the final target price.

| Estimated range | JPY 100.65 – JPY 102.23 |
| Resistance line | JPY 101.73 |
| Support line | JPY 101.05 |
Today’s Important Economic Indicators
| Economic Indicators and Events | JST (Japan Standard Time) |
| Australian Policy Rate Announcement | 13:30 |
| EU Consumer Price Index | 18:00 |
*Trading advice in this article is not provided by Milton Markets, but by Shu Fujiyasu Jr., a certified technical analyst.