Dollar/Yen continues to fall, focus on today’s U.S. employment data【June 2, 2023】
June 02, 2023
Markets Analysis
目次
Fundamental Analysis
- U.S. ADP Employment Report Exceeds Market Estimates, 278,000; Wage Growth Declines
- U.S. jobs report due out today, estimate 195,000
- Fed Governor and Fed Chair Jerome Powell support halting interest rate hikes, halting dollar strength
- USD/JPY remains on a downtrend, hovering around JPY 138.820
USDJPY Technical Analysis
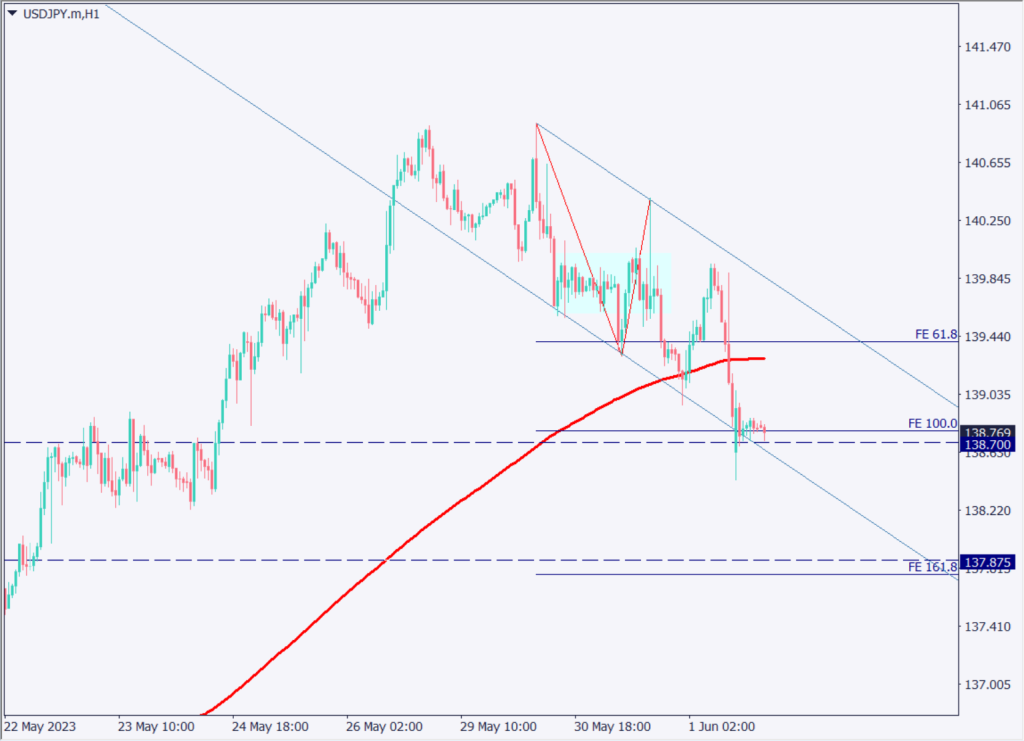
The USD/JPY has shifted the stage from the JPY 139 level to the JPY 138 level due to increased volatility at the beginning of the month. On the 1-hour timeframe, the pair is still in a downtrend, having fallen below the 240 moving average. On the 4-hour time frame, the Fibonacci retracement and the price range formed in the past, and on the 1-hour time frame, the formation of a descending channel should be watched.
Swing Analysis (4-hourly)
Analyzing the 4-hour chart of the dollar-yen, the 138.30-138.70 range, which is the price range of the range formed in the past, may serve as a support band. Whether or not the downward momentum will strengthen in the future is still likely to be determined by the FOMC meeting to be held on June 13-14. Since this is a rather large support zone, there is a possibility that profit-taking and push-buying may take place.

Day Trade Strategy (Hourly)
Analyzing the 1-hour chart of the USD/JPY, the main focus on the 1-hour chart is the formation of the descending channel and the target price based on the Fibonacci Expansion.
Currently, the pair is hovering near the lower band of the descending channel, and we note the possibility of an adjustment rebound once it occurs. In particular, after the release of the employment data, weekend position adjustment moves are likely to occur, which may result in short-covering. Even in the event of a rally, we expect it to be short-lived due to the presence of moving averages. Although it depends on the employment data, we should keep in mind that the support band is thick.
Support and Resistance Lines
The resistance line to be considered in the future is as follows
138.30 yen – Lower limit of the past range price
138.10 yen – Fibonacci retracement (38.2%)
137.87 yen – Fibonacci Expansion (161.8%)

Market Sentiment
USDJPY Sell: 67% Buy: 33%
Today’s Important Economic Indicators
| Economic Indicators and Events | JST (Japan Standard Time) |
| U.S. Employment Statistics | 21:30 |
| U.S. ISM Manufacturing Purchasing Managers’ Index | 23:00 |
*Trading advice in this article is not provided by Milton Markets, but by Shu Fujiyasu Jr., a certified technical analyst.