USDJPY decline pauses; Fibonacci level gains awareness【July 17, 2023】
July 17, 2023
Markets Analysis
目次
Fundamental Analysis
- U.S. Stock Indexes Rebound; Recession in U.S. Interest Rate Hike Remains a Factor in Gains
- U.S. Consumer Sentiment Index Rebounds, Boosting Stock Prices
- U.S. Dollar Index slumps sharply, nears 8-month low
USDJPY Technical Analysis
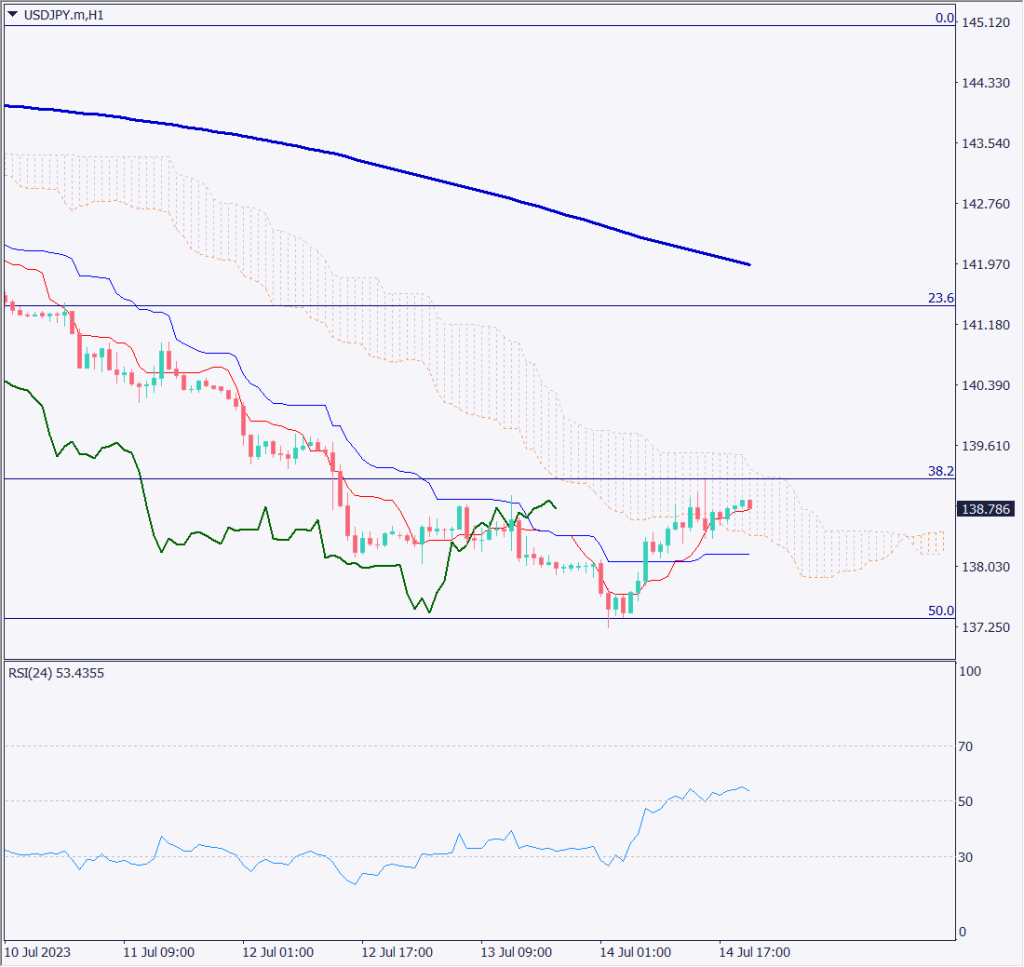
With few important indicators this week, the week is likely to be sensitive to technical analysis and stock prices. Although the pair fell to the low ¥137’s on expectations of a change in the BOJ’s interest rate policy, it rebounded at the halfway point of the major uptrend and may provide a push going forward.
However, the upside is still likely to be heavy due to strong expectations of a YCC revision. Until the results are announced on July 28, it is difficult to move either up or down. With Fibonacci in mind, particular attention should be paid to moves around the 50% mark at 137.30 yen and 139.18 yen.
Day Trading Strategy (Hourly)
The day trade policy is to pull back enough to sell back. Considering on a daily basis, the market is oversold, so we would like to return and sell on the rebound. If the price moves above the Ichimoku Kinko Chart cloud, it could bounce 23.6% to 141.40 yen. Therefore, on an hourly basis, we would wait until the RSI is above 70 and below 70 again.
Support and Resistance Lines
The resistance line to be considered in the future is as follows
139.18 JPY – Fibonacci 38.2%.
137.30 JPY – Fibonacci 50%.
Market Sentiment
USDJPY Sell: 35% Buy: 65%
Today’s Important Economic Indicators
| Economic Indicators and Events | JST (Japan Standard Time) |
| None in particular | – |
*Trading advice in this article is not provided by Milton Markets, but by Shu Fujiyasu Jr., a certified technical analyst.