Gold tests support at USD 1,900, selling pressure from continued high U.S. interest rate policy【August 16, 2023】
August 16, 2023
Markets Analysis
目次
Fundamental Analysis
- U.S. Retail Sales Beat Market Estimates, Signaling Resilience of U.S. Economy
- U.S. PPI beat market expectations, indicating concern that high U.S. interest rates will remain high for a long period of time
- Gold falls back to around USD 1900, with stop-losses involved and a drop in sight
XAUUSD Technical Analysis
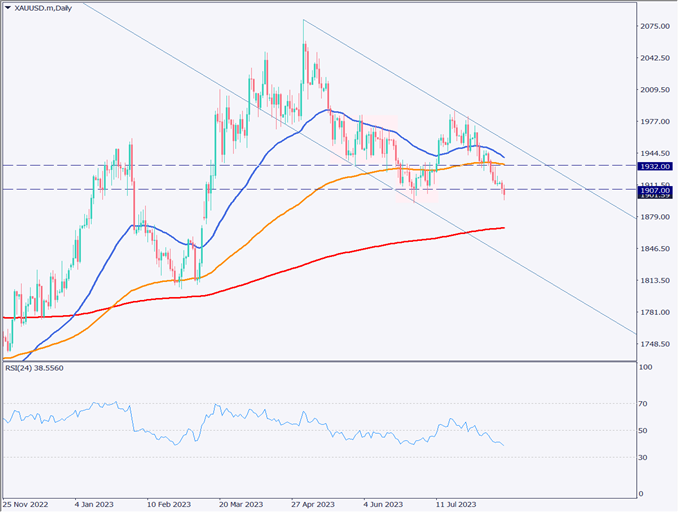
Analysis of the daily chart of Gold confirms a move below the milestone USD 1907 and temporarily below USD 1900. Technically, USD 1893 is located as an important support line, and this price is also noted as a recent low. A break below USD 1893 could result in a sharp drop to the lower line of the declining channel.
Although buying interest is seen near USD 1900, the fundamental backdrop suggests a continued state of selling pressure. Therefore, if the price breaks below USD 1893, the next support on a daily basis is likely to be USD 1867, where the 240 moving average is trending lower. Selling pressure, both fundamental and technical, should be watched carefully.

Day Trading Strategy (Hourly)
Analysis of the hourly chart of Gold confirms that the moving average is in the position of a perfect order and that a strong downtrend has been in place for an extended period of time. In particular, the short-term 24 moving averages are of particular interest, and there is little movement above this line. Fundamentally, gold is also susceptible to selling off due to the strong dollar.
Against this backdrop, our day trading strategy is to sell back. As a specific trading strategy, the entry price is set at USD 1907, the profit target at USD 1895, and the stop loss at USD 1910. If the RSI reaches around 30, we will close even if the price does not reach USD 1895.
Support and Resistance Lines
The resistance line to be considered in the future is as follows
1907 USD – Major resistance level
1895 USD – Major support zone

Market Sentiment
XAUUSD Sell: 23% Buy: 77%
Today’s Important Economic Indicators
| Economic Indicators and Events | JST (Japan Standard Time) |
| EU GDP | 18:00 |
| Number of Construction Permits | 21:30 |
| Highlights of the FOMC Meeting | Next day at 3:00 |
*Trading advice in this article is not provided by Milton Markets, but by Shu Fujiyasu Jr., a certified technical analyst.