Divergence appears in the USDJPY, weakening upward momentum【September 11, 2023】
September 11, 2023
Markets Analysis
目次
Fundamental Analysis
- The pair fell through a window to 146.60 JPY early in the morning, with the possibility of a window-filling move
- BOJ Governor says data will be available by the end of the year to assess price trends
- Yen strengthens on expectations of BOJ policy normalization, divergence emerges in USD/JPY
USDJPY Technical Analysis
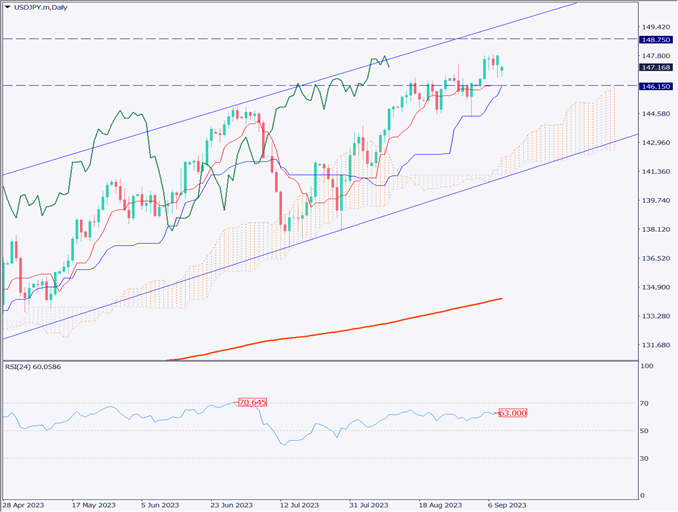
Analyze the daily chart of the USD/JPY market. The dollar index has rallied for eight consecutive weeks, suggesting overheating. This overheating is increasing the possibility that the dollar buying trend will weaken, and the USD/JPY may enter an adjustment phase.
A possible target for adjustment is 146.15 JPY. At this level, the Ichimoku Kinko Chart’s conversion line and base line overlap and are likely to function as a solid support band. Furthermore, divergence can be seen in the RSI, which should be watched closely as a sign of a future change in tone, especially a decline.

Day Trading Strategy (Hourly)
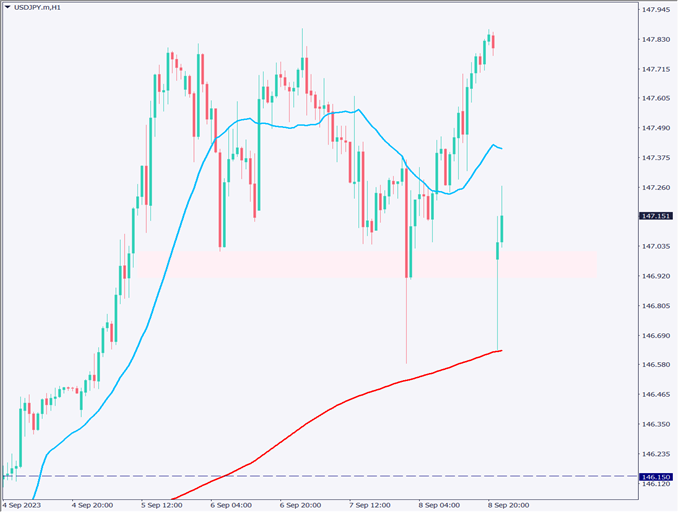
Analyze the hourly chart of the USDJPY market. It shows a window opening and a sharp drop to the latter half of 146 JPY. After such a window-opening, the window is often filled in the morning of Tokyo time, and this is likely to be the case this time as well.
The area around 146.90-147 JPY is likely to act as a resistance zone, as it has seen reactions in past trades. Furthermore, the 240 moving average is also located nearby, and a reaction with this line in mind is expected. The dollar index is overheated, which could lead to sharp fluctuations in currency strength.
As for trading policy, it would be better to aim to buy at a deep push and consider a short settlement. Entry points are 146.90 JPY, 146.65 JPY, and 146.15 JPY, with a stop at 145.90 JPY and a target price of 148.86 JPY.
Support and Resistance Lines
The resistance line to be considered in the future is as follows
147.00 JPY – Neckline
146.15 JPY – Support line for technical indicators

Market Sentiment
USDJPY Sell: 71% Buy: 29%
Today’s Important Economic Indicators
| Economic Indicators and Events | JST (Japan Standard Time) |
| None in particular | – |
*Trading advice in this article is not provided by Milton Markets, but by Shu Fujiyasu Jr., a certified technical analyst.