USD/JPY Recovers to the 150 Range, Rise in US 10-Year Treasury Yield as the Cause【November 7, 2023】
November 07, 2023
Markets Analysis
目次
Fundamental Analysis
- Rise in US 10-Year Treasury Yield, USD/JPY Recovers to the 150 Range
- The market anticipates about four rate cuts by 2024
- USD/JPY rebounds at the baseline of the Ichimoku Kinko Hyo, focus on whether it will surpass the conversion line again
USDJPY Technical Analysis
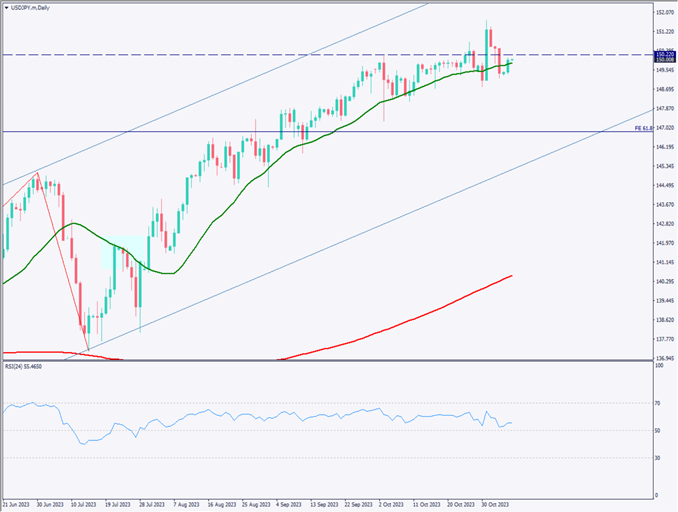
Analyzing the daily chart of USD/JPY. It is moving within an ascending channel, and although momentum has weakened, there is a repetition of buying on dips when it falls. The 24MA is acting as a support line, and it has once again closed above the 24MA.
It’s difficult to forecast future developments, but as long as Bank of Japan’s policy does not change, the pressure for a weaker yen is likely to continue. The next upside targets appear to be 150.22 JPY and 151.70 JPY.
Day Trading Strategy (Hourly)
Analyzing the 1-hour chart of USD/JPY. The 240 moving average line is looming above, making the upside slightly heavy. The RSI is at 54, indicating a shift back to an upward trend. In the foreign exchange market, there is a strong pressure towards a stronger dollar and weaker yen.
Attention should be paid today to whether it exceeds 150.22 JPY. If it surpasses 150.22 JPY, there is a possibility of rising towards the recent high of 151.770 JPY.
The day trading policy is to buy on dips. Entry is at 149.85 JPY, take profit at 150.50 JPY, and stop loss at 149.50 JPY.
Support and Resistance Lines
The resistance line to be considered in the future is as follows
150.22 JPY – A major resistance line

Market Sentiment
USDJPY Sell: 65% Buy: 35%
Today’s Important Economic Indicators
| Economic Indicators and Events | JST (Japan Standard Time) |
| Australian Policy Interest Rate | 12:30 |
*Trading advice in this article is not provided by Milton Markets, but by Shu Fujiyasu Jr., a certified technical analyst.