EURUSD Falls Below 1.10 USD, Strengthening USD Due to Rising U.S. Interest Rates【October 8, 2024】
Fundamental Analysis
EURUSD has formed a double top and broken the neckline.
Crude oil prices surge as concerns rise over the escalating conflict between Israel and Iran.
The U.S. 10-year bond yield rises to 4%, putting pressure on stock prices.
EURUSD technical analysis
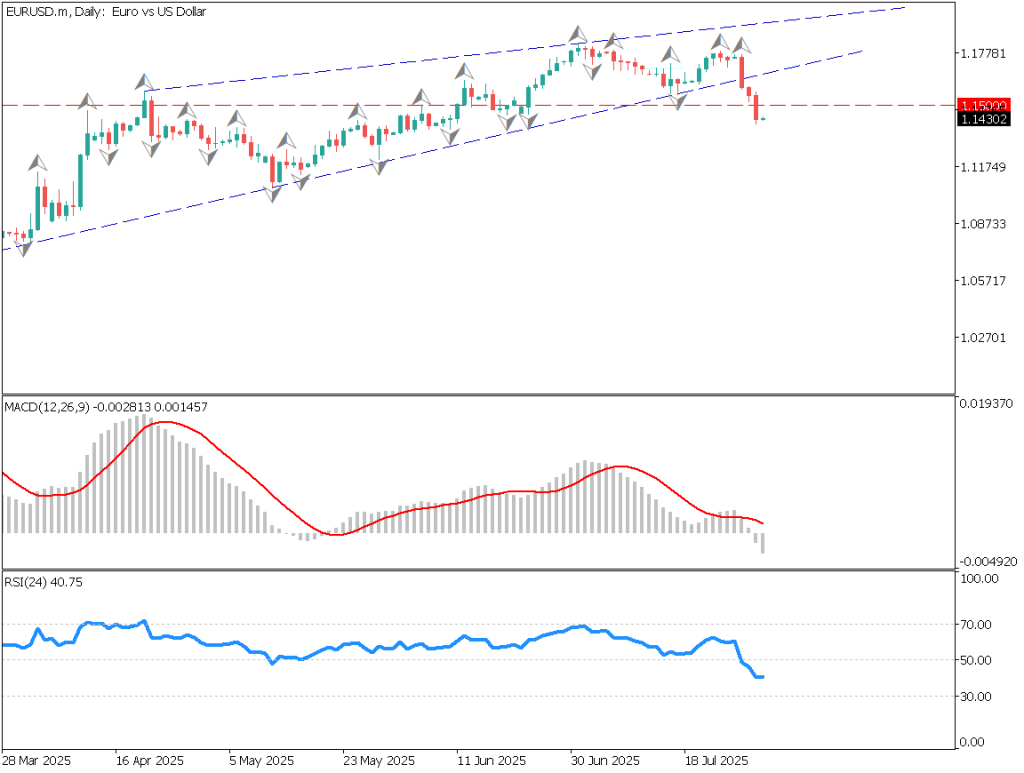
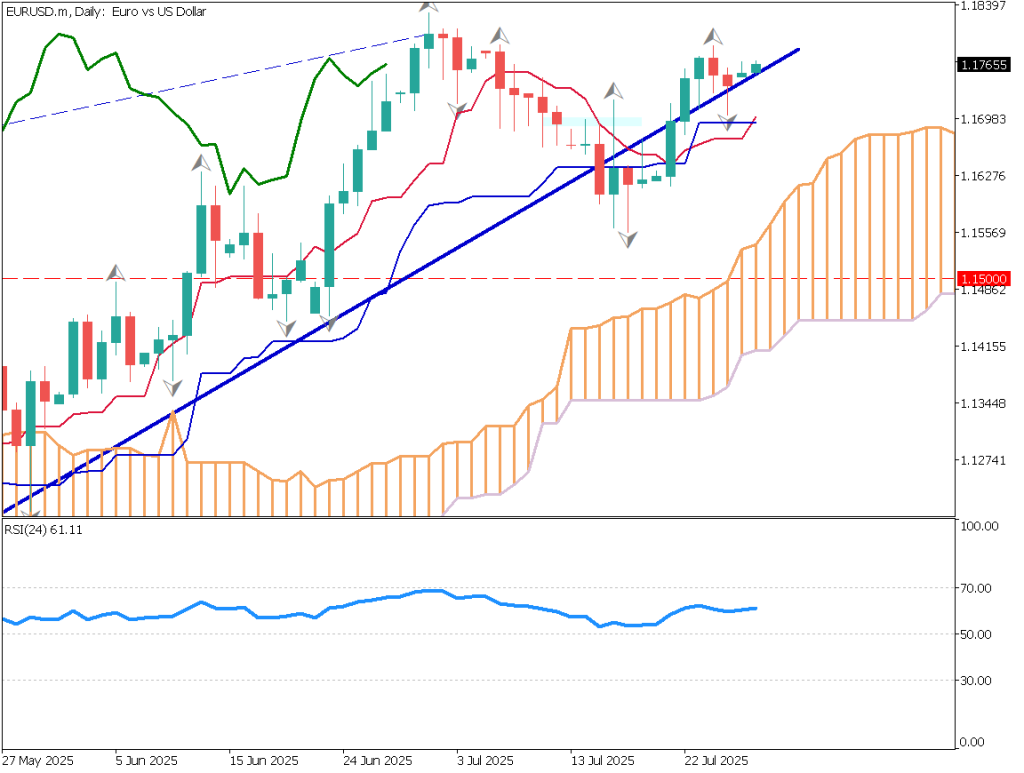
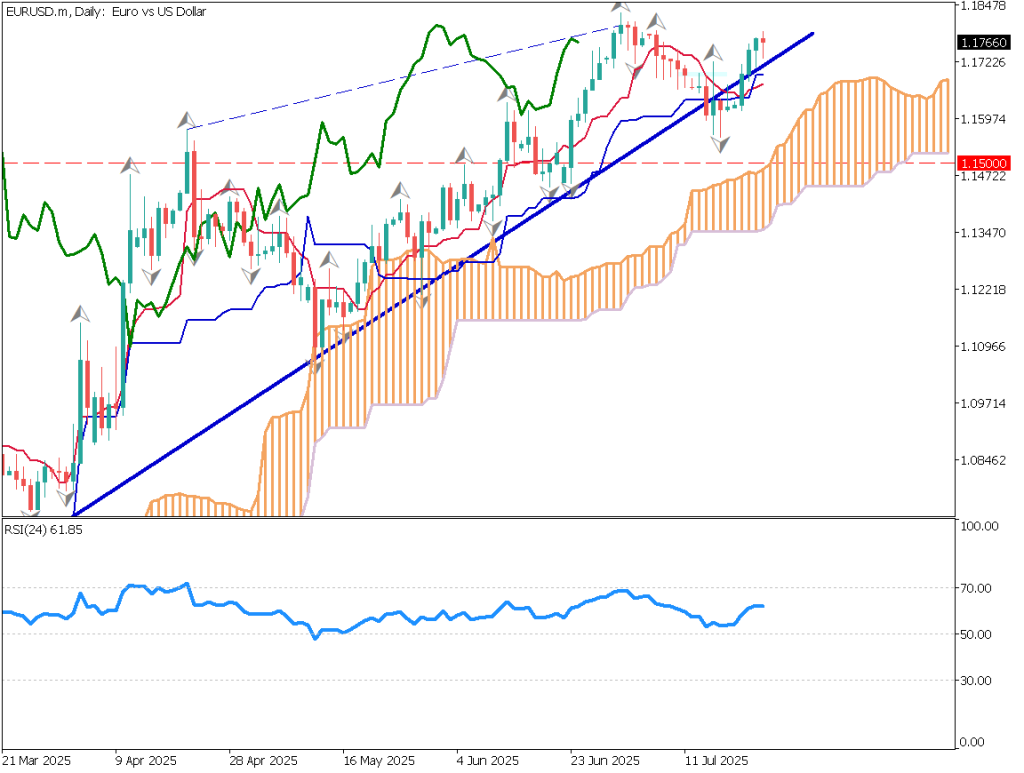
Analyzing the daily chart of EURUSD, the pair has formed a double top and broken the 1.10 USD neckline. After breaking the neckline, a “return move” occurs, where the market tests whether the neckline has turned into a resistance line.
Currently, the 90-day moving average acts as support, with the candles trapped between the resistance line at 1.10 USD and the support of the moving average.
If EURUSD rebounds from the neckline and breaks below the 90-day moving average, stop losses on long positions could be triggered, leading to a significant drop. The U.S. 10-year bond yield has risen above 4.0%, strengthening the USD. This week’s U.S. CPI data and key figure speeches are worth watching.
Day trading strategy (1 hour)
Analyzing the 1-hour chart of EURUSD, round numbers play a significant role. The levels of 1.10 USD and 1.0950 USD function as resistance and support lines, respectively. In the 1-hour chart, the pair appears to be in a range, making it difficult to time entries.
Considering the overall movement on the daily chart, selling near 1.10 USD could be a good strategy.
A break below the 90-day moving average on the daily chart could be seen as a sell signal. Watch closely for a break below 1.0950 USD. If EURUSD drops below 1.0950 USD, aggressive selling is recommended. Target profits around 1.0900 USD. If EURUSD rises above 1.10 USD again, it should trigger a stop loss.
Support/Resistance lines
The support and resistance levels to consider going forward are as follows:
1.10 USD: Round number / neckline
1.0950 USD: Recent low
Market Sentiment
EURUSD Short: 18% / Long: 82%
Today’s important economic indicators
Economic indicators and eventsJapan timeJapan Household Spending8:30Australia RBA Meeting Minutes9:30Bostic Speech1:45 (next day)Bundesbank President Speech2:00 (next day)
*Trading advice in this article is not provided by Milton Markets, but by Shu Fujiyasu Jr., a certified technical analyst.
Risk Disclaimer
This analysis is for educational purposes only and does not constitute investment advice. Trading forex and CFDs involves significant risk and may not be suitable for all investors. Past performance is not indicative of future results.
This analysis is for educational purposes only and does not constitute investment advice. Trading forex and CFDs involves significant risk and may not be suitable for all investors. Past performance is not indicative of future results.


