Gold Reaches Historic High of Over 2700 USD, Supported by Fundamentals Despite Overbought Conditions【October 21, 2024】
Fundamental Analysis
Israel assassinates Hamas leader Sinwar; Iran’s influence grows
Ongoing unrest in the Middle East, and the U.S. presidential election shake the markets
Gold surges to a historic high of over 2700 USD, driven by demand for safe-haven assets
XAUUSD technical analysis
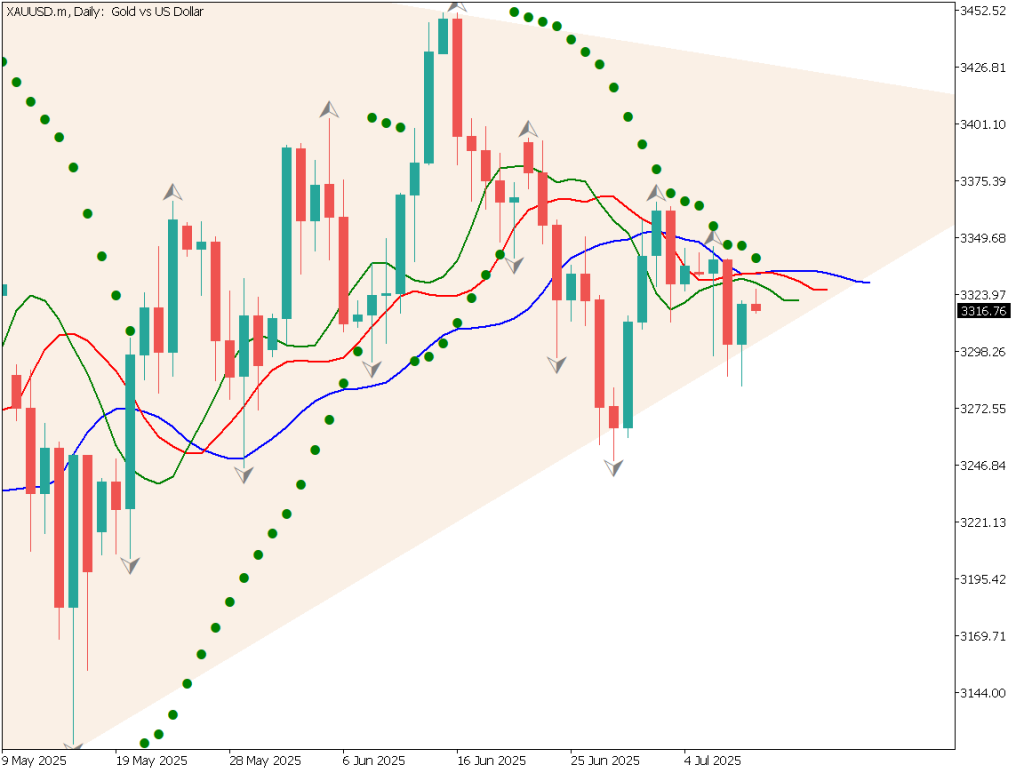
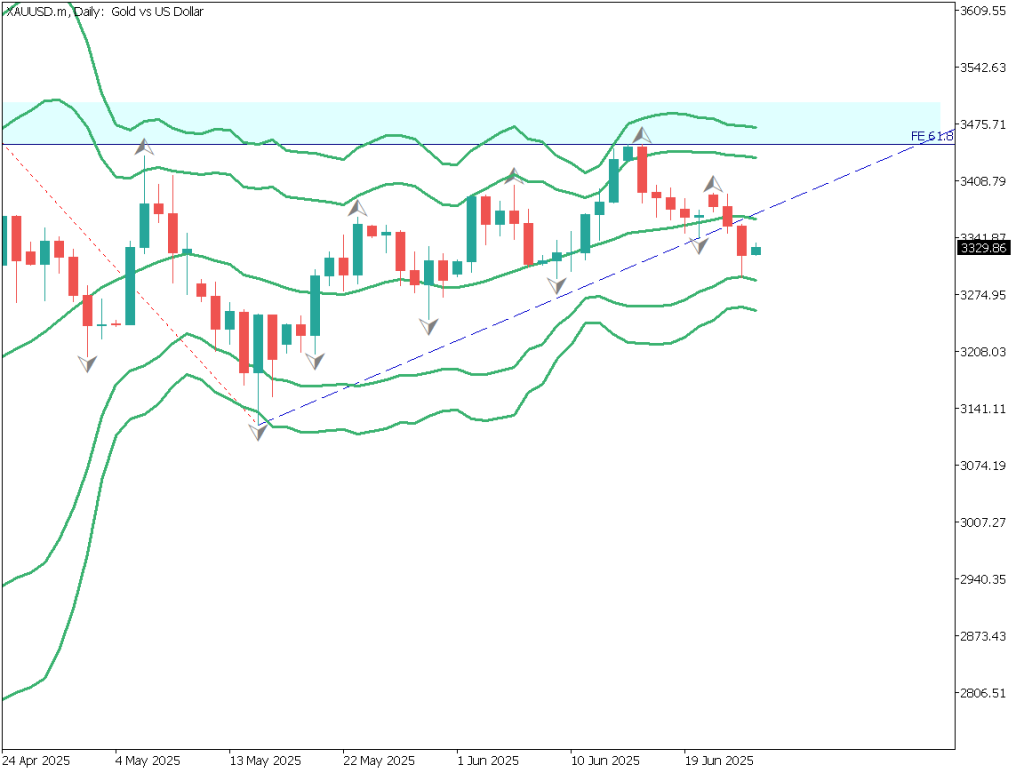
Analyzing the daily chart of gold: Gold has touched the +3σ line of the Bollinger Bands. The +3σ line indicates that 99.7% of candlesticks remain within this band, and breaking above it suggests a higher probability of a price correction.
Gold has reached the 2700 USD range for the first time, surging to 2720 USD due to stop-loss orders. A pullback is expected at the start of the week. Historically, gold has gone through adjustment phases whenever it entered new price ranges.
With no signs of stability in the Middle East and the U.S. presidential election becoming increasingly unpredictable, the fundamentals suggest continued buying during price dips.
Day trading strategy (1 hour)
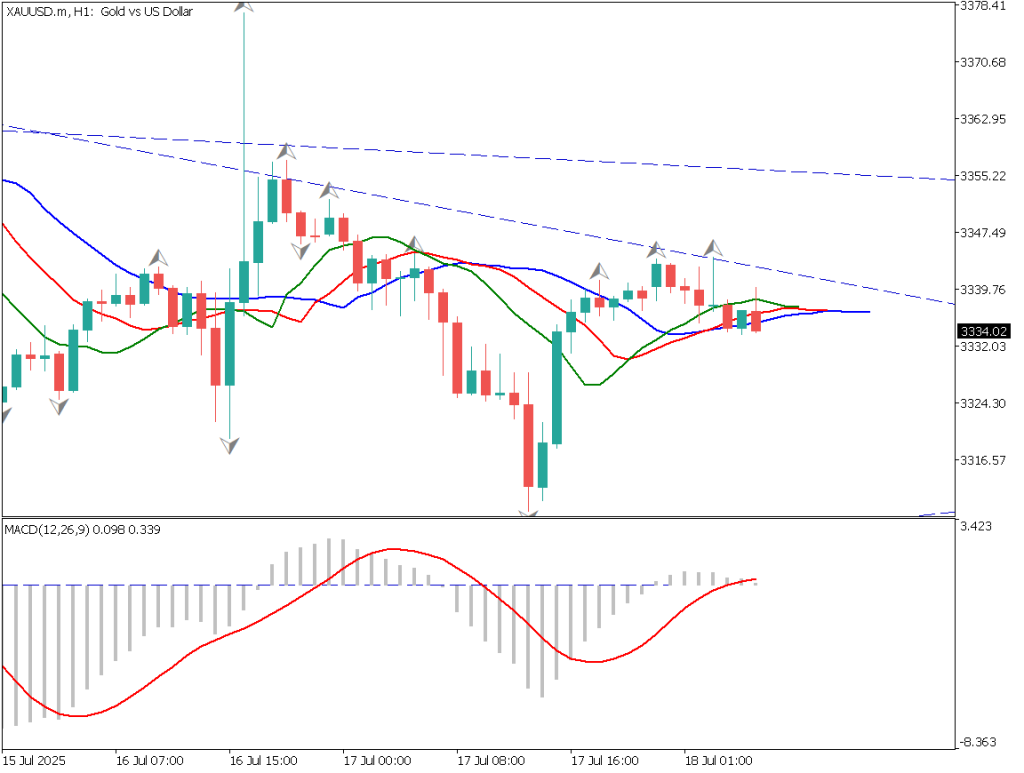
Analyzing the 1-hour chart of gold: Gold is forming an upward channel and is sticking to the upper boundary line. The probability of a pullback is high, so caution is advised when holding long positions in the 2700 USD range. With the price deviating from the 10MA, it could drop to the lower 2700 USD range.
The day trading strategy focuses on buying the dips. Setting a deep buy limit order would be ideal. The best scenario is buying the dip around the 10MA at 2710 USD or the channel’s lower boundary near 2695 USD. Although the precise point of correction is uncertain, buying on the dips should be prioritized.
However, given that gold is near the +3σ line on the daily chart, short positions could also be considered for short-term trading.
Support/Resistance lines
The following support and resistance levels should be considered going forward:
2740 USD: Fibonacci expansion 100%
2700 USD: Round number
Market Sentiment
XAUUSD Sell: 65% Buy: 35%
Today’s important economic indicators
Economic Indicators and EventsJapan TimeU.S. Leading Economic Index23:00FOMC Member Speech02:00 (next day)
*Trading advice in this article is not provided by Milton Markets, but by Shu Fujiyasu Jr., a certified technical analyst.
Risk Disclaimer
This analysis is for educational purposes only and does not constitute investment advice. Trading forex and CFDs involves significant risk and may not be suitable for all investors. Past performance is not indicative of future results.
This analysis is for educational purposes only and does not constitute investment advice. Trading forex and CFDs involves significant risk and may not be suitable for all investors. Past performance is not indicative of future results.


