USD/JPY shows yen strength—temporary correction?【July22,2025】
July 22, 2025
Markets Analysis
USD/JPY Swing Trade Strategy
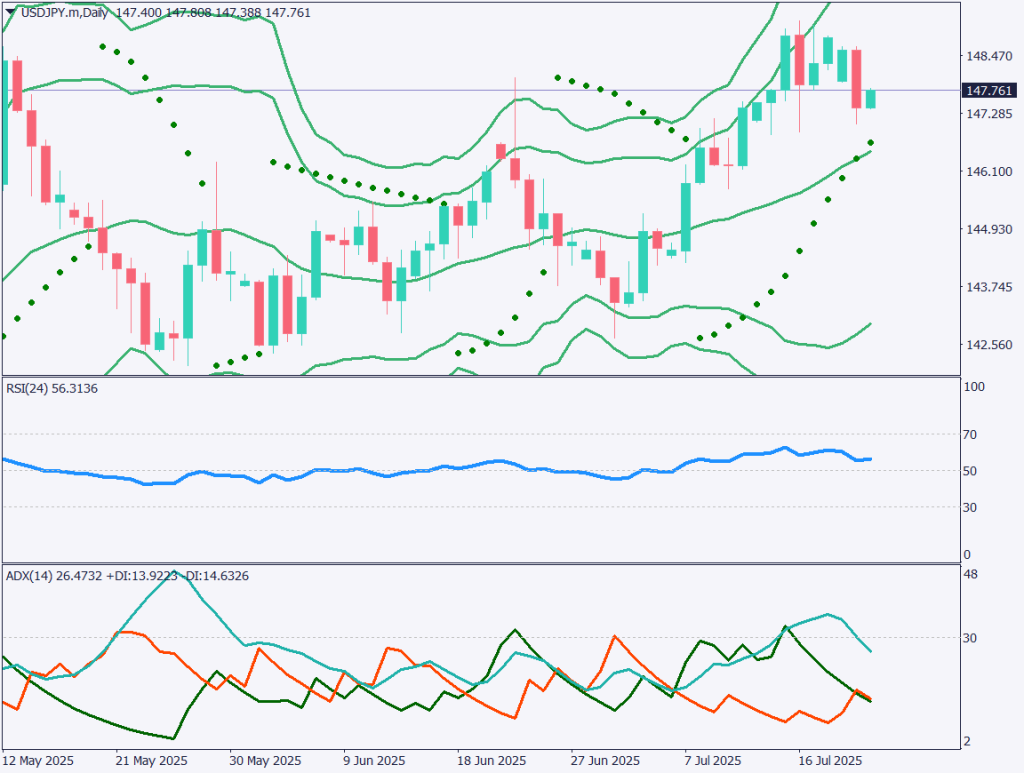
An analysis of the daily USD/JPY chart shows the pair hovering around 147.76. Following the Upper House election, the yen has strengthened against the dollar. While the Bollinger Bands are expanding upward, indicating a general trend of yen depreciation, the current move appears to be a natural correction. Attention should be paid to whether the price rebounds off the midline of the Bollinger Bands.
The pair is approaching the Parabolic SAR, often used as a stop-and-reverse signal. If a reversal occurs, a larger correction may follow.
Despite fading concerns over excessive fiscal spending, the current political instability makes it difficult for the Bank of Japan to raise interest rates. The RSI stands at 56, suggesting that upward pressure remains.
USDJPY Day Trading Strategy
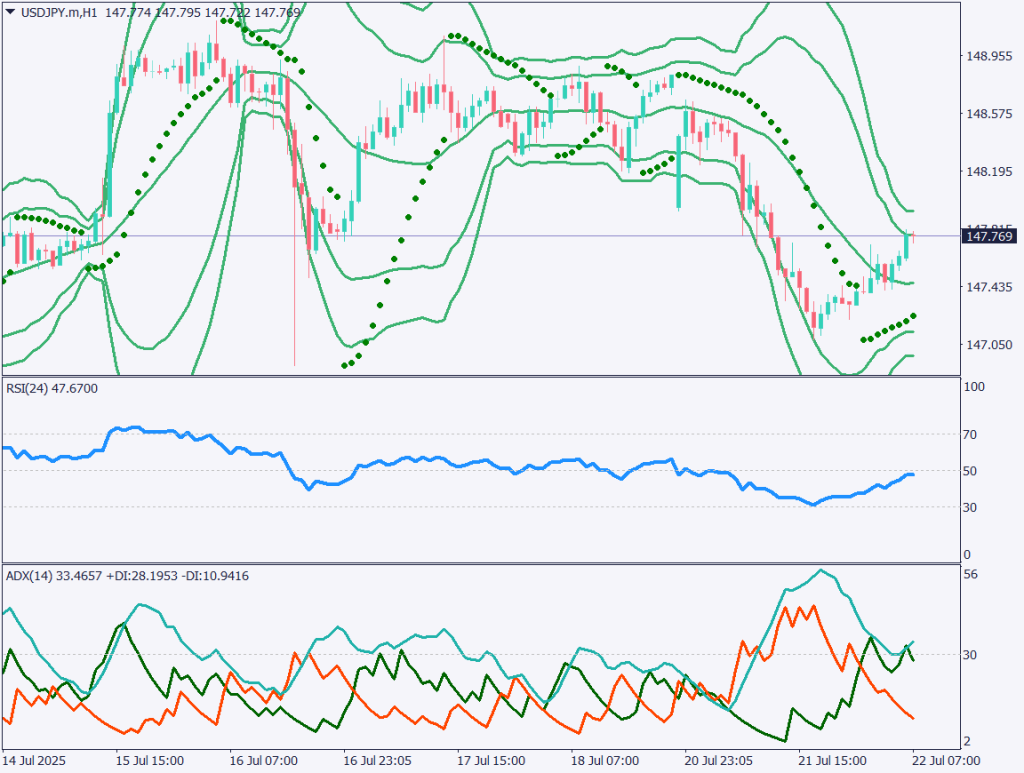
On the 1-hour chart, USD/JPY has broken out downward from a range, dropping to the lower 147 area before rebounding. The RSI fell to 30, which may have triggered a corrective rebound. However, it is difficult to conclude that the move was based on a clear fundamental factor.
Whether the pair can break back above 148 will be a key point. Market attention is focused on the outcome of U.S.-Japan tariff negotiations and the stability of the current administration.
From a short-term day trading perspective, a short position may be attempted. However, the mid- to long-term outlook remains bullish.
Suggested entry:
Buy limit at 146.90
Stop loss: Below 146.50
Take profit: Near the upper range at 148.90
Key Economic Events Today
| Event/Indicator | Time(JPT) |
| Reserve Bank of Australia Meeting Minutes | 10:30 |
| Fed Chair Powell Speech | 21:30 |