Exchange rates may shift to a stronger dollar trend, or note a trend shift in the straight dollar currency【May 15, 2023】
May 15, 2023
Markets Analysis
目次
Fundamental Analysis
- Major U.S. stock indexes continue to fall; University of Michigan consumer confidence index unexpectedly rises
- No progress on the U.S. debt ceiling issue; sentiment deteriorates as default deadline looms
- Expectations of a halt in U.S. interest rate hikes receded; another rate hike likely in June
- Dollar rallied sharply during the New York session, with straight-dollar currency pairs fluctuating sharply
- Crude oil down for a third straight day; China’s economic recovery slower than expected
Technical Analysis
The dollar strengthened rapidly and the dollar-straight currency pairs moved sharply higher. Most major currency pairs were triggered to break out of resistance and support zones. The chart of the dollar index shows a chart shape that suggests the dollar’s strengthening trend is likely to continue for some time.
Currency strength and weakness are the basis of FX trading, and the movement of the U.S. dollar affects all currency pairs and issues. Caution should be exercised as the trend may gain momentum after a trend reversal.
Dollar-Yen (USDJPY)
Analysis of the 4-hour time frame of the dollar-yen shows that the pair has broken above JPY 135.50, which had been a major resistance zone, and has risen to JPY 135.75. Similar to the shape of a double bottom, the pair is likely to rise if the dollar continues to strengthen. The near-term price target is expected to be JPY 137.
Looking at the daily chart, there is a 240-day moving average near JPY 137, which has served as a strong resistance zone in the past. It has failed to be broken through twice, and the focus will be on whether it can be broken above this time.
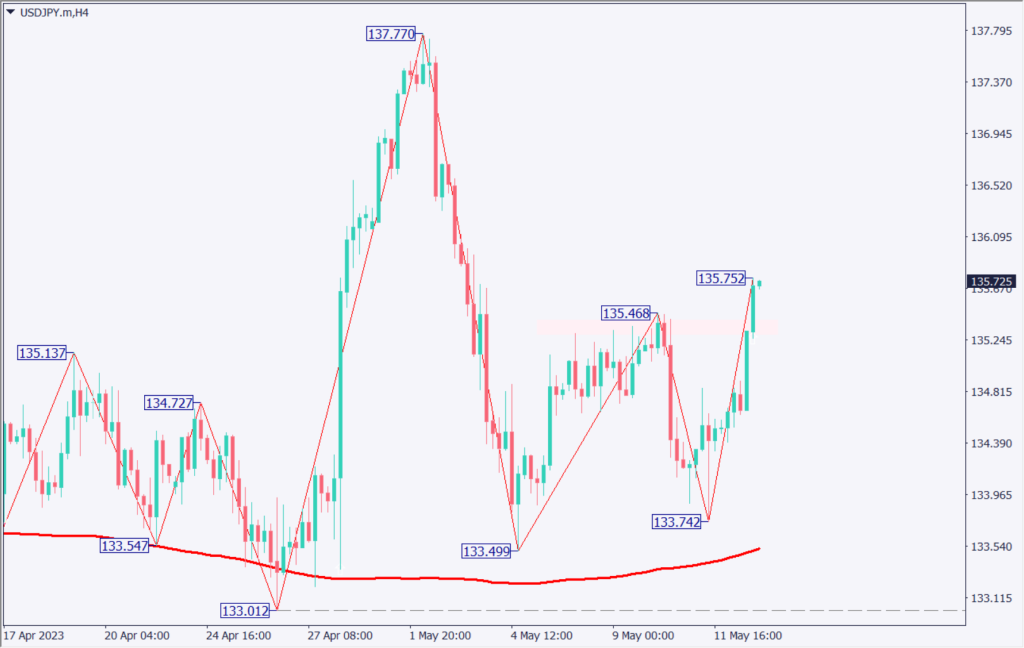
| Estimated range | JPY 134.70 – JPY 137.00 |
| Resistance line | JPY 135.80 |
| Support line | JPY 135.20 |
NZ-Dollar (NZDUSD)
The NZ dollar has plunged sharply in two days, covering a week of gains in just two days. Analysis of the daily chart shows that the momentum of the decline may be calming down as the 240-day moving average is now below. A large rangebound market is expected to continue.
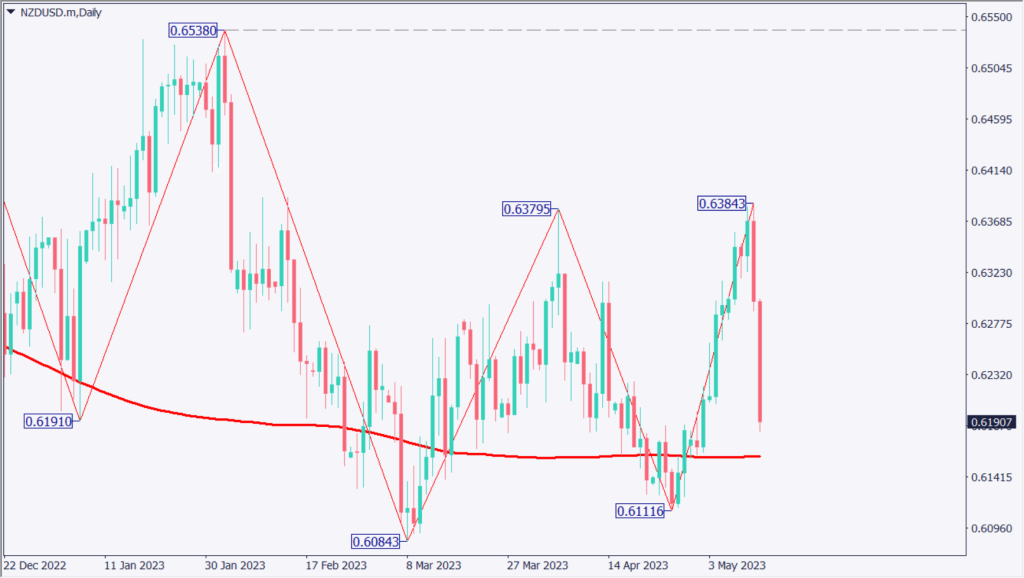
| Estimated range | USD 0.6069 – USD 0.6315 |
| Resistance line | USD 0.62250 |
| Support line | USD 0.6110 |
GOOGLE (Alphabet)
Chart analysis of Google introduced in the Hot Report. Microsoft-based AI has been getting a lot of attention recently, and Google is currently lagging behind. On May 6, Google announced plans for a major revamp of its search engine, and it was reported that AI will be introduced. Expectations for the AI developed by Google have risen, forming an up-gap and rising.
The upward momentum is also strong as the market has been range-bound since March. Drawing a Fibonacci Expansion, the target price is around USD 127.
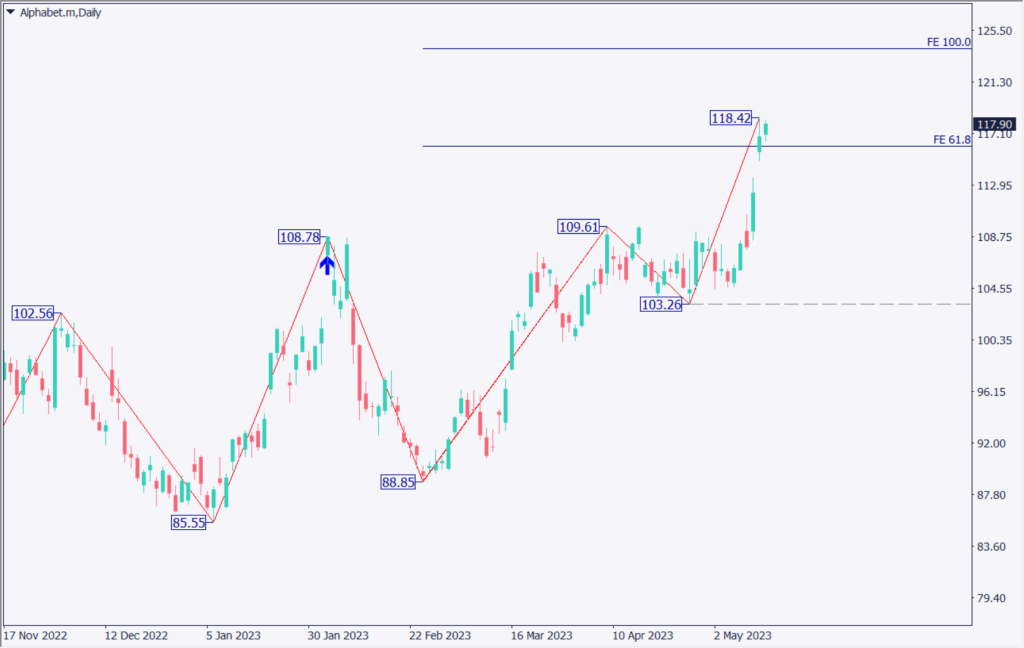
| Estimated range | USD 114.30 – USD 122 |
| Resistance line | USD 120.9 |
| Support line | USD 115.6 |
Today’s Important Economic Indicators
| Economic Indicators and Events | JST (Japan Standard Time) |
| No important economic indicators | – |
*Trading advice in this article is not provided by Milton Markets, but by Shu Fujiyasu Jr., a certified technical analyst.