Exchange rates move slightly higher; U.S. debt ceiling negotiations hit a snag【May 16, 2023】
May 16, 2023
Markets Analysis
目次
Fundamental Analysis
- Major U.S. Stock Indexes Slightly Higher, Remain in Range, Lack Direction
- U.S. Debt Ceiling Negotiations Stall; White House Optimistic, House Speaker Says Agreement Far from Agreed Upon
- Hawkish comments from U.S. financial officials were prominent, with some saying they are not considering a rate cut before the end of the year
- The dollar recovered to the JPY 136 level, continuing three days of gains
- Currency markets were nervous, with major currency pairs moving in a range with no significant movement
- Bitcoin completes a window-filling move, rebounding at the equilibrium cloud
- Crude oil rebounded at USD 70/bbl, with strong buying potential below USD 70/bbl
- Gold moves modestly, resistance near USD 2020
Technical Analysis
Currency markets remain in a state of low volatility with no significant movements. The U.S. debt ceiling negotiations have been difficult and the trend has been difficult to follow. The dollar has a large sell order near JPY 136.20, which has failed to break through four times. It is difficult to trade and difficult to discern the direction. We would be cautious about new trades.
U.S. Retail Sales is scheduled to be released today, and volatility is expected to increase.
Dollar-Yen (USDJPY)
Analyze the daily chart of the dollar/yen. While the overall exchange rate is moving modestly, the USD/JPY exchange rate has risen to the JPY 136 level. It is confirmed that the price is rebounding at the 28-day moving average and is being restrained to the upside by the 240-day moving average.
Going forward, the moving averages are close to each other and a breakout to either the upside or downside is possible within a week or two. The longer the range period, the greater the breakout is likely to be. We want to be prepared for either a breakout above JPY 137 or a breakout below JPY 135.

| Estimated range | JPY 134.90 – JPY 137.30 |
| Resistance line | JPY 136.70 |
| Support line | JPY 135.16 |
Euro-Dollar (EURUSD)
Analyze the daily chart of the Eurodollar. It is in a downtrend and we can see that the price has fallen below the 38.2% Fibonacci retracement at the close. The price may push lower to around USD 1.080, which is half the price.
However, there is a large support band near USD 1.0838 and USD 1.0824. The price is likely to rebound around this price zone. Even if the price drops temporarily to USD 1.08, we expect a rebound is likely. This is the price area to consider buying at the push.
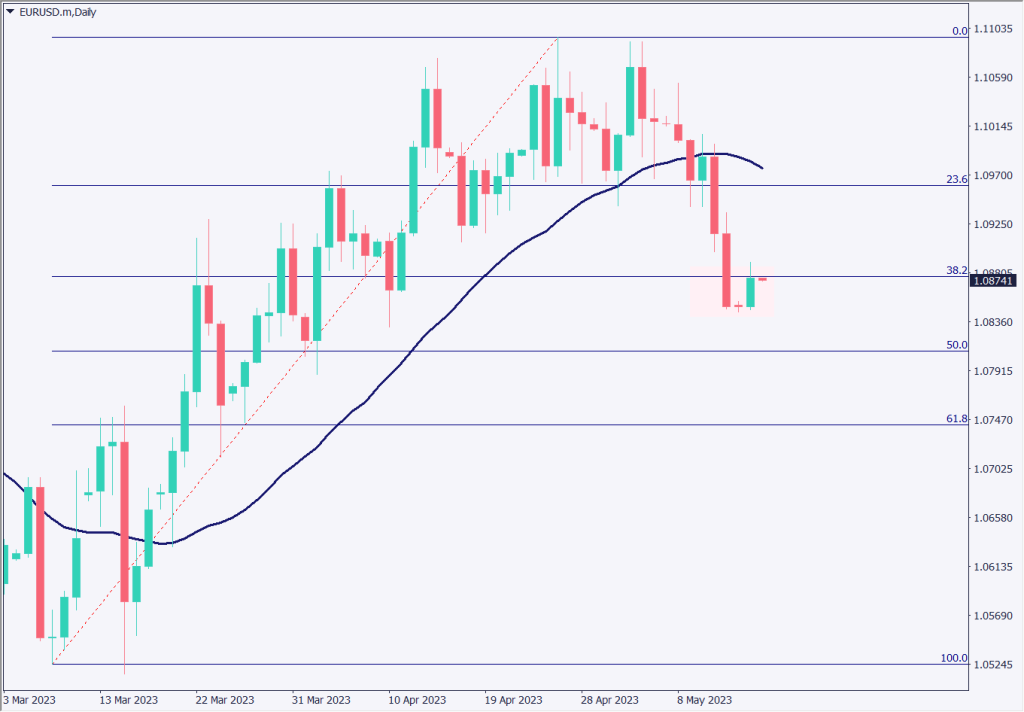
| Estimated range | USD 1.080 – USD 1.095 |
| Resistance line | USD 1.093 |
| Support line | USD 1.083 |
Pound Sterling-Yen (GBPJPY)
The daily chart of GBP/JPY is analyzed. The price is on a gradual uptrend, and the 28-day moving average can be seen as a support line for a rebound. The barrier at JPY 170.50 is thick, but stop-losses may be waiting in the price area up to JPY 171.
The U.K. average wage is scheduled to be released today and is likely to be seen as an important reference indicator to see if inflation is slowing down. We would like to follow the market, taking care to trade before and after the release of economic indicators.
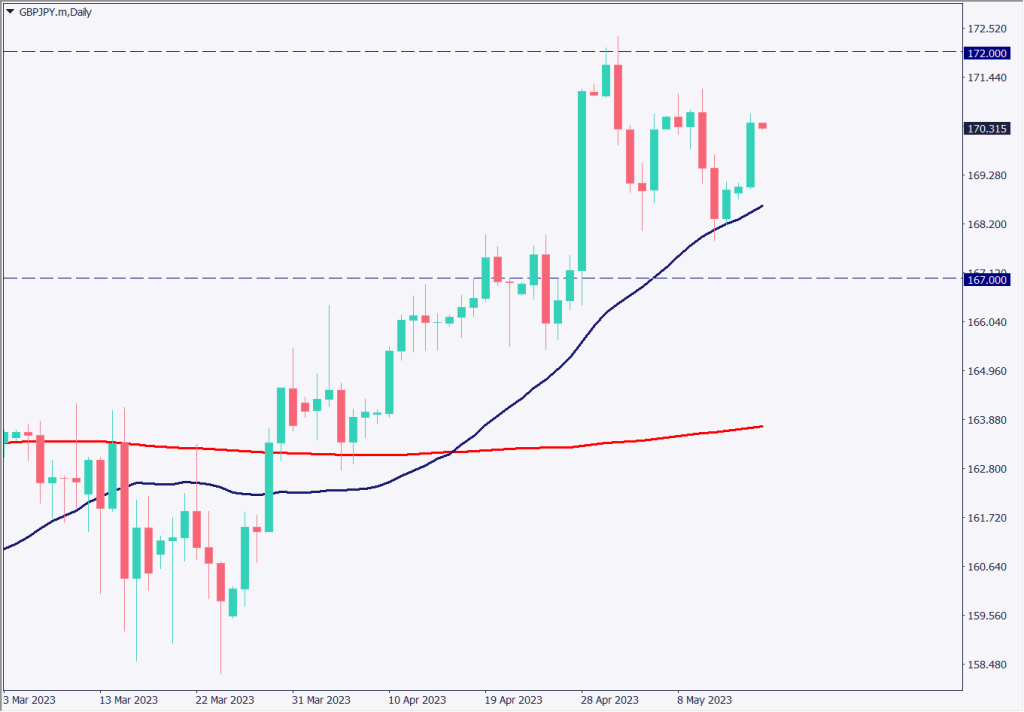
| Estimated range | JPY 169.0 – JPY 172.0 |
| Resistance line | JPY 170.62 |
| Support line | JPY 169.70 |
Today’s Important Economic Indicators
| Economic Indicators and Events | JST (Japan Standard Time) |
| Bank of Australia Monetary Policy Meeting Agenda | 10:30 |
| UK Average Wage | 15:00 |
| Germany ZEW Economic Expectations Index | 18:00 |
| U.S. Retail Sales | 21:30 |
*Trading advice in this article is not provided by Milton Markets, but by Shu Fujiyasu Jr., a certified technical analyst.