U.S. debt ceiling deadline looms, currency markets adjust and risk aversion moves【May 22, 2023】
May 22, 2023
Markets Analysis
目次
Fundamental Analysis
- Major U.S. Stock Indexes Fall Back; U.S. Default Deadline Looms, Negotiations Suspended
- FRB Chair Powell References Credit Stress on Financial Institutions, Hints at Suspension of Interest Rate Hikes
- Treasury Secretary Yellen Comments on Need for Large Regional Bank Mergers
- Gold, Yen, and Swiss Franc rise as funds flow into safe-haven assets
- Dollar Index falls back, depending on future progress in U.S. debt ceiling negotiations
- Government officials declare that default will be avoided, creating an opportunity to buy at the margin
Technical Analysis
Positional adjustments over the weekend led to a pause in the dollar buying trend. The dollar index fell back and straight dollar currency pairs moved into adjustment. In addition, no progress was made on the U.S. debt ceiling issue, which has a one-week deadline. Risk aversion also led to buying of gold and the yen.
Dollar-Yen (USDJPY)
Analyze the daily chart of the dollar-yen. A large double bottom with a rising low has formed, and the neckline can be estimated to be around JPY 137.90-138.30. On Friday, the pair fell back due to an adjustment, but if the risk of a U.S. default is avoided, we expect the pair to gain momentum to the upside above the neckline.
However, if a default were to occur, yen buying would be sharply stronger. In this case, JPY 130.12 would be the lower boundary guideline.
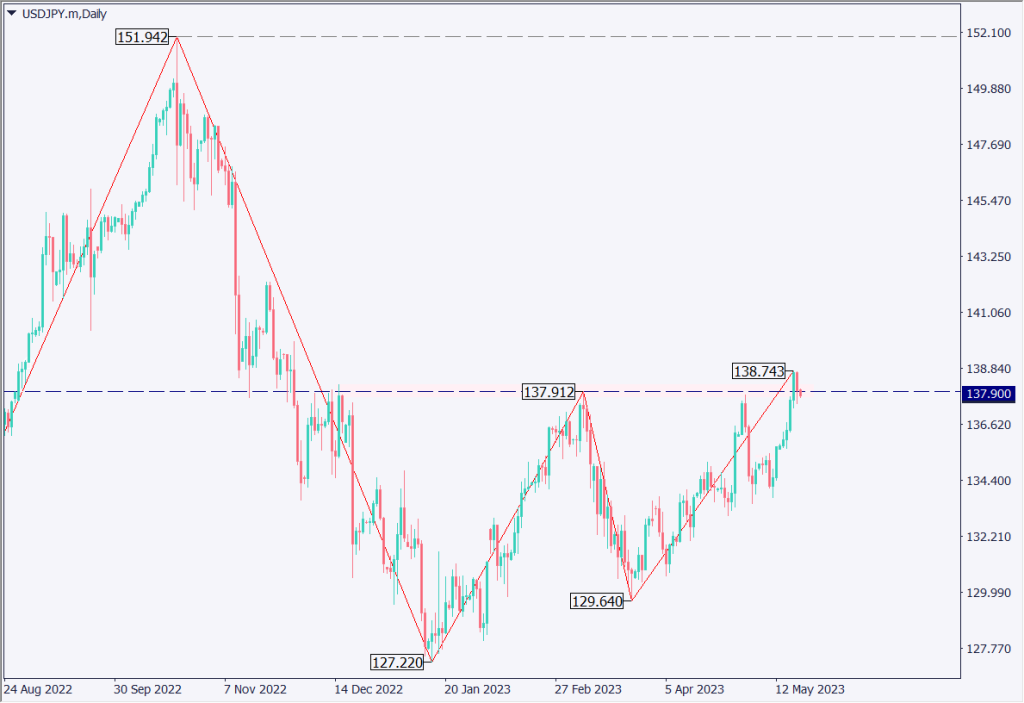
| Estimated range | JPY 136.70 – JPY 139.17 |
| Resistance line | JPY 138.75 |
| Support line | JPY 137.36 |
NASDAQ
The Nasdaq 100 is rising steadily. Analysis of the daily chart shows a pullback near USD 13,910, which corresponds to the 100% of the Fibonacci Expansion. We expect the Nasdaq to make an adjustment once, although there is a high probability that it will continue to rise in the medium to long term.
Since it is reacting at the +2σ line of the Bollinger Band, the possibility of a bandwalk is possible. We will focus on whether the price can reach the USD 14,000 level this week and look for a push-back opportunity.
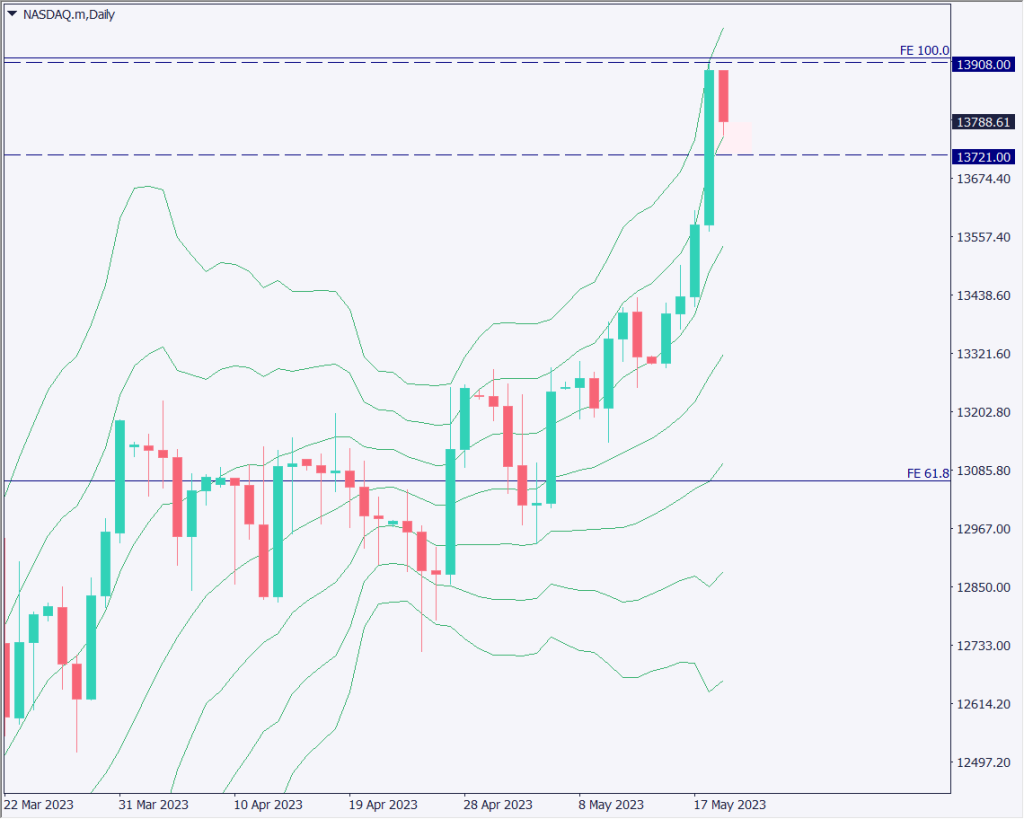
| Estimated range | USD 13,580 – USD 13,950 |
| Resistance line | USD 13,908 |
| Support line | USD 13,720 |
Apple (APPLE)
We analyze the daily chart of the Apple stock price chart, which was also featured in the Hot Topic Report. Apple’s financial results have remained strong, and the company’s entry into electric vehicles and enhanced AI have raised expectations. The upward trend line can be drawn, and since the stock has rebounded three times in the past, it can be assumed that it is likely to remain conscious of this trend line.
The resistance zone will be USD 176.08, the recent high, and USD 177.33, which corresponds to 100% of the Fibonacci Expansion. There may be some adjustment due to profit-taking, but the basic strategy should be a push-buy strategy.
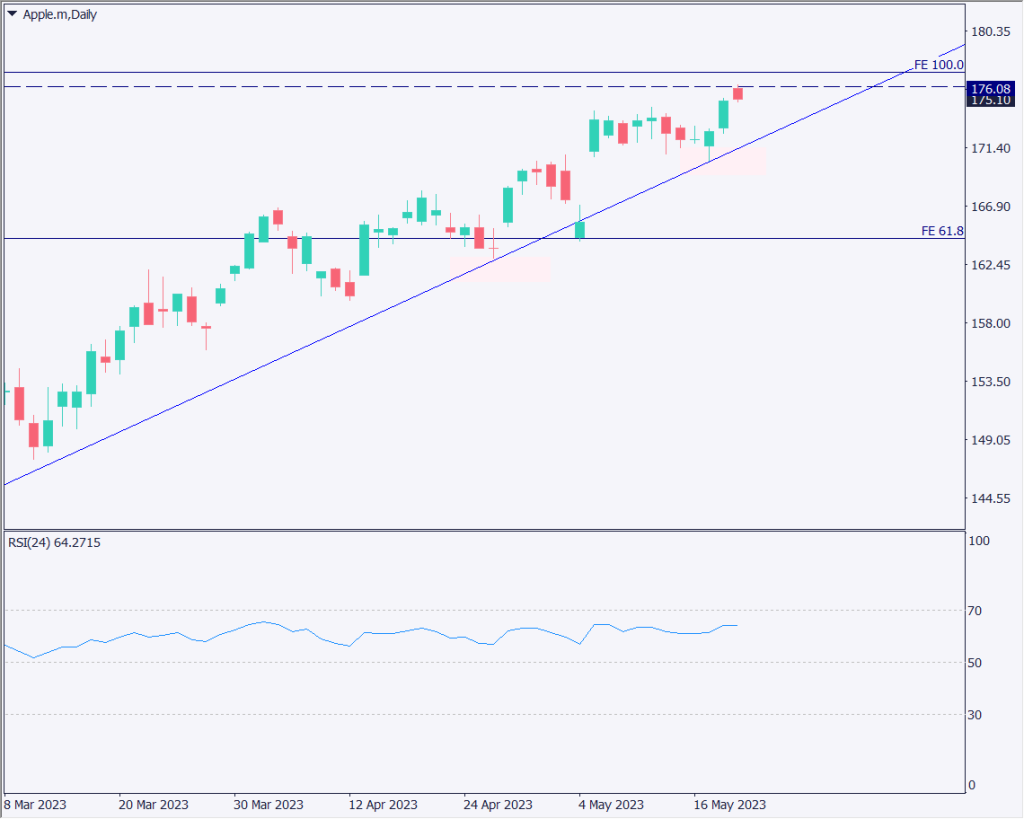
| Estimated range | USD 173.3 – USD 178.6 |
| Resistance line | USD 176.08 |
| Support line | USD 174.22 |
Today’s Important Economic Indicators
| Economic Indicators and Events | JST (Japan Standard Time) |
| None in particular | – |
*Trading advice in this article is not provided by Milton Markets, but by Shu Fujiyasu Jr., a certified technical analyst.