USDJPY nearing 140 level, default risk gradually increasing【May 25, 2023】
May 25, 2023
Markets Analysis
目次
Fundamental Analysis
- Dow Jones Industrial Average falls USD 270, downside pressure builds as debt ceiling negotiations run into difficulties
- The Nasdaq bounces back at the end of NY session, forming a positive line with a lower whisker
- The Bank of New Zealand raised its policy rate by 0.25%, but some votes to keep the rate unchanged caused a sharp decline
- USDJPY rises to JPY 139.40, near-term upside is JPY 140.42
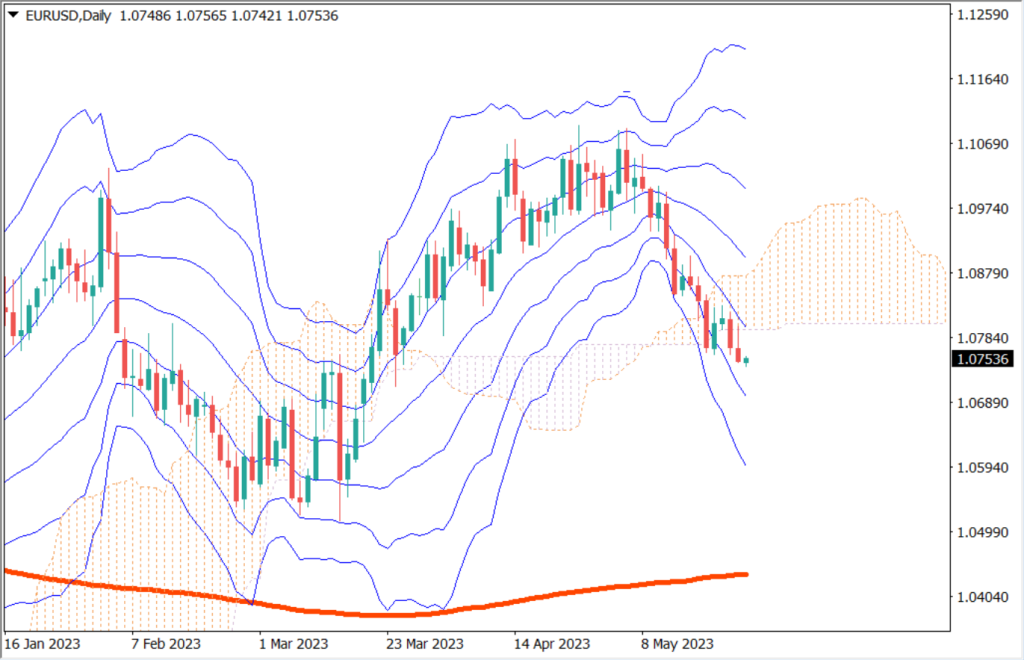
- Eurodollar falls, below the equilibrium cloud
- Pound dollar falls; inflation rate falls to 8.7%, leading to selling of the pound dollar
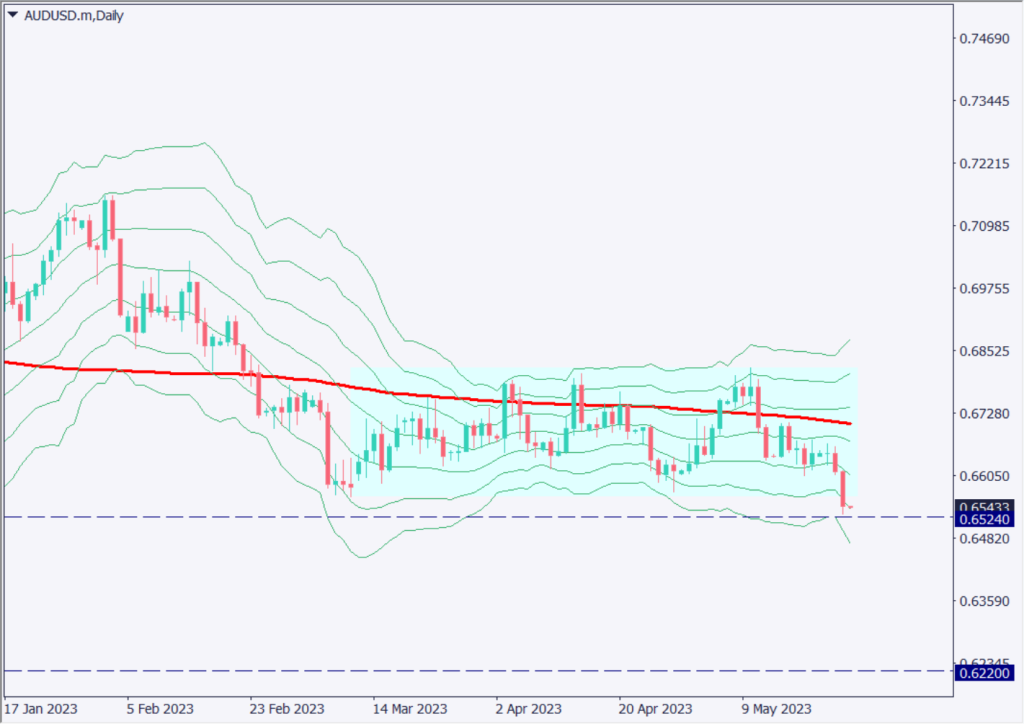
- Oceania currency pair falls sharply, nearing the lower price limit of the range
- Gold falls, falls below USD 1,960 as dollar buying intensifies
Technical Analysis
Dollar buying prevailed during the New York session. The U.S. debt ceiling negotiations have been difficult and the deadline is looming. Markets are becoming increasingly anxious. We are in the final stages of a global policy rate hike and the terminal rate is close. Therefore, we are at a stage where it is difficult to see the direction of the market, with some insisting on a hike and others insisting on remaining unchanged. This is where the focus is on short-term trades.
On the other hand, some currency pairs are showing signs of a trend. The Australian dollar could make a big move if it breaks below the range.
Euro Dollar (EURUSD)
The Eurodollar is clearly on a downtrend. It has rebounded once through the clouds on the equilibrium chart, but now we can see that the clouds are acting as a resistance zone. With the dollar buying dominating, the probability of a decline in the eurodollar is high, and we expect a near-term downside target around USD 1.0720.

| Estimated range | USD 1.067 – USD 1.0821 |
| Resistance line | USD 1.0785 |
| Support line | USD 1.0713 |
Australian Dollar (AUDUSD)
The Australian dollar is moving down from a long sustained range. When this shape appears, we consider the “N” word. The target price is calculated to be USD 0.6220. There is a large support band at USD 0.65240 on the downside, which could rebound once the price breaks below USD 0.6524. We will be watching to see if the price breaks below USD 0.6524.

| Estimated range | USD 0.6482 – USD 0.66 |
| Resistance line | USD 0.6562 |
| Support line | USD 0.6510 |
Nikkei Stock Average (NIKKEI225)
The Nikkei Stock Average hit a new post-bubble high. The very strong rise continued, but there is a strong resistance zone at JPY 31,280, which is causing profit-taking selling. We can confirm that an outside bar (wrap-around), which occurs as a signal of reversal at higher prices, is in place.
Although there will be an adjustment at one point, we expect that the price will be back on an upward trend at JPY 30,180. We expect that the price is likely to rebound at the +1σ of the Bollinger Band and form a gradual upward trend.

| Estimated range | JPY 29,890 – JPY 31,680 |
| Resistance line | JPY 31,280 |
| Support line | JPY 30,180 |
Today’s Important Economic Indicators
| Economic Indicators and Events | JST (Japan Standard Time) |
| U.S. Gross Domestic Product | 21:30 |
*Trading advice in this article is not provided by Milton Markets, but by Shu Fujiyasu Jr., a certified technical analyst.