Gold Surges as Russian Situation Becomes Unstable, Geopolitical Risks Rise【June 26, 2023】
June 26, 2023
Markets Analysis
目次
Fundamental Analysis
- U.S. stock indexes fall back, worsening U.S. economic indicators and the prospect of higher interest rates increase fears of recession
- Russian Military Company Wagner Armed, Marches into Moscow, Temporarily on High Alert
- Wagner head Prigogine leaves Russia, influence in Ukraine conflict wanes
- Gold rises on rising geopolitical risks, from USD 1,910 to USD 1,937 level
XAUUSD Technical Analysis
Gold has broken below its range and is now selling off. Gold’s attractiveness had declined after the U.S. Fed indicated that it expected to raise interest rates twice this year. It sold off to the USD 1910 support band, but rallied sharply due to tensions within Russia. It was bought up to USD 1937 and was trading in the USD 1924 range at the end of the week.
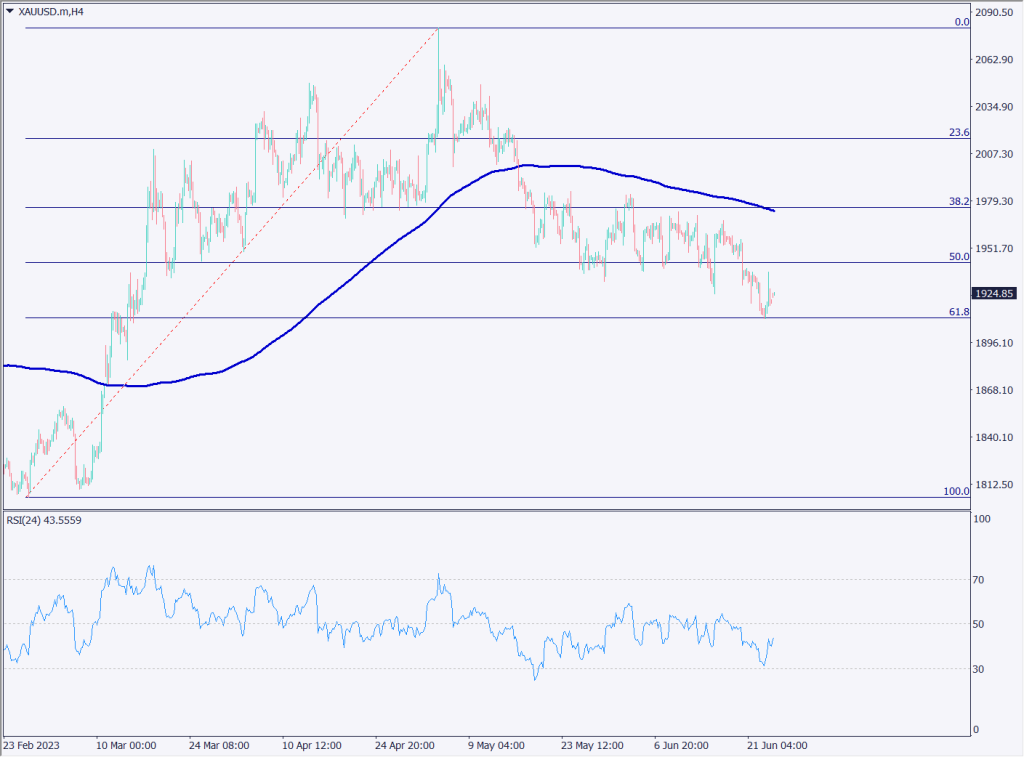
Long-term analysis (4-hour chart)
Analyze the 4-hour chart. Drawing a Fibonacci retracement on the highs and lows that are milestones, we can see that 61.8% of the price has rebounded, corresponding to USD 1910. In addition, the RSI has rebounded at an oversold level of 31 and is at 43.
Since divergence is occurring in the 4-hour RSI, the price may rise again if it does not break below USD 1900. On the other hand, if it breaks below USD 1900, the price may drop all the way down to around USD 1860 with stop loss involved.
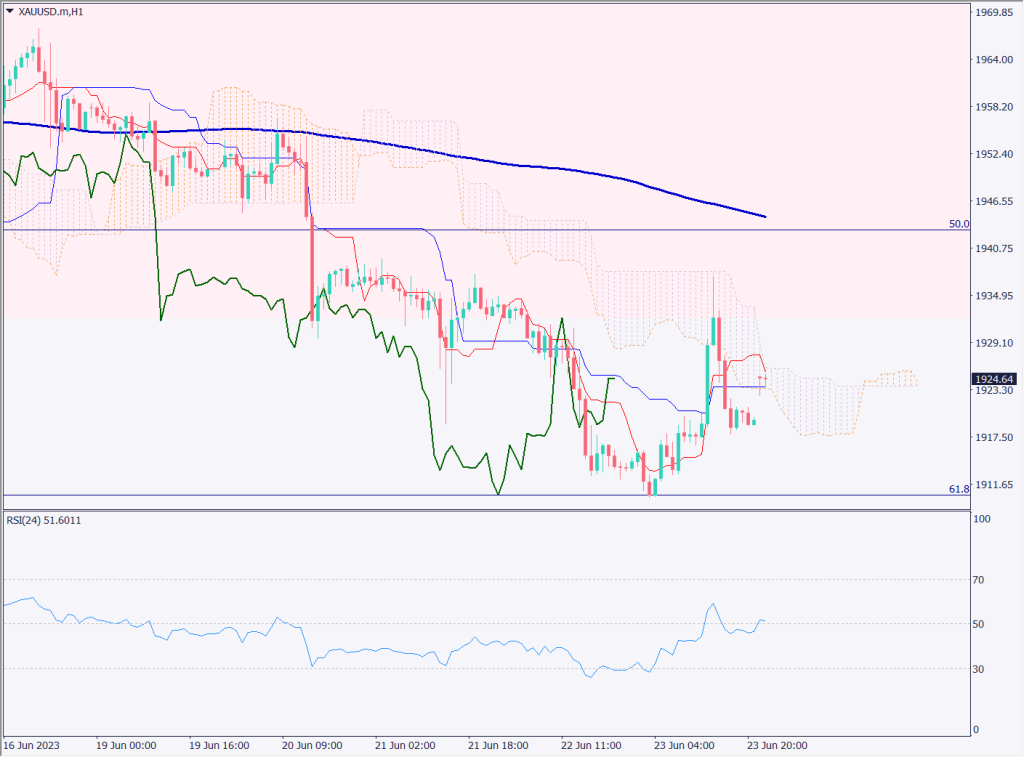
Short-term analysis (hourly)
Analyze the hourly chart of Gold, which has rallied sharply to around USD 1937 after rebounding at USD 1910. This corresponds to the upper cloud price on the equilibrium chart. The price has since fallen back, but the lagging line is above the candlestick and the conversion line is above the base line.
The RSI is hovering around 51, recovering to a predominantly buying level; a break above 59, the recent high for the RSI, could lead to a move toward 70. In other words, price appreciation could gain momentum.
Day Trading Strategy
The day trade policy is to buy deep push. Chart-wise, the market is selling off, but there is a large support zone around USD 1900. Also, USD 1895 corresponds to S2 of the pivot point, and we would like to buy in the USD 1895 – USD 1900 area.
If the price breaks below USD 1895, the support band is almost gone and the price could fall sharply. A stop loss should always be set. We can also consider following the short-term downward direction. If we set up a sell, we would consider closing near USD 1886 and USD 1881.
Support and Resistance Lines
The resistance line to be considered in the future is as follows
1922 USD – Pivot point
1900 USD – Major support zone (round number)
1895 USD – Pivot point S2
Market Sentiment
XAUUSD Sell: 34% Buy: 66%
Today’s Important Economic Indicators
| Economic Indicators and Events | JST (Japan Standard Time) |
| June German IFO Business Confidence Index | 17:00 |
| Remarks by ECB President Lagarde | Next day at 1:30 |
*Trading advice in this article is not provided by Milton Markets, but by Shu Fujiyasu Jr., a certified technical analyst.