Gold Recovers to USD 1920, Will It Break Out of the Downward Channel?【August 29, 2023】
August 29, 2023
Markets Analysis
目次
Fundamental Analysis
- Jackson Hole Meeting Speech by Chairman Powell Passes without a Whimper
- Market awaits U.S. jobs report, continues to search for direction
- Gold’s focus is on whether it will break above the descending channel
XADUSD Technical Analysis
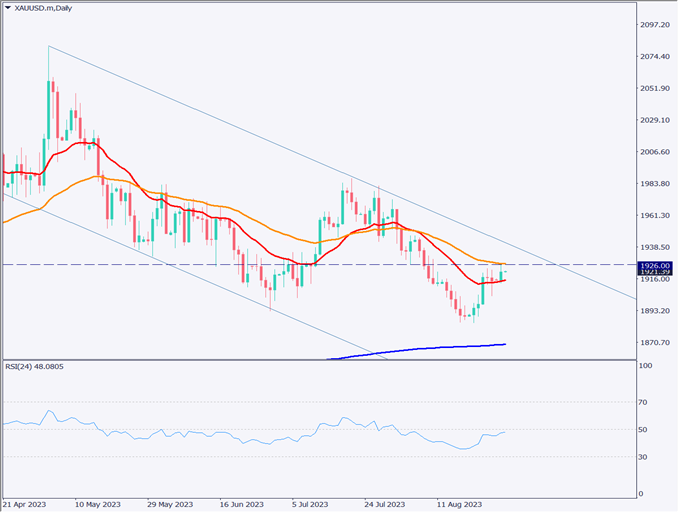
Analysis of the daily chart of the gold market shows that it is in a descending channel and the downtrend is continuing. Fed Chairman Powell was somewhat cautious about additional rate hikes, but his speech was still hinting at a rate hike.
This allowed Gold to recover to $1920, with the RSI hovering around 50, indicating a close.
Gold is also above its 10-moving average, but the 24-moving average is resistance. This indicates that a short-term uptrend may have begun, but a medium-term trend reversal has yet to occur.
The key point going forward is whether the 24 moving averages are breached and the RSI exceeds 50. If these conditions are met, a shift to an uptrend can be expected. Conversely, if the 24-moving average is not breached and the RSI turns downward, a resumption of the downtrend is likely.

Day Trading Strategy (Hourly)
Analyzing the hourly chart of the gold market, we believe that the market is above the 10, 24, and 240 moving averages and that the upward trend is continuing in the short term. However, the daily resistance line at $1926 is formidable. Market sentiment is also approaching a state of positional tilt, and we expect a one-sided sense of direction to be difficult to find for some time. Especially with the upcoming employment data release, cautious trading is called for.
Our trading policy is range trading. Specifically, we aim to push the price near the 240 moving average, with a close at $1926 and a stop at $1916. However, we need to pay close attention to the release of the employment report and other event risks.
Support and Resistance Lines
The resistance line to be considered in the future is as follows
1926 USD – Major resistance line
1919.66 USD – Pivot point

Market Sentiment
XAUUSD Sell: 56% Buy: 44%
Today’s Important Economic Indicators
| Economic Indicators and Events | JST (Japan Standard Time) |
| Employment Statistics for the Day | 8:30 |
| U.S. Consumer Confidence Index | 23:00 |
*Trading advice in this article is not provided by Milton Markets, but by Shu Fujiyasu Jr., a certified technical analyst.